New Vehicle Sales – October 2018

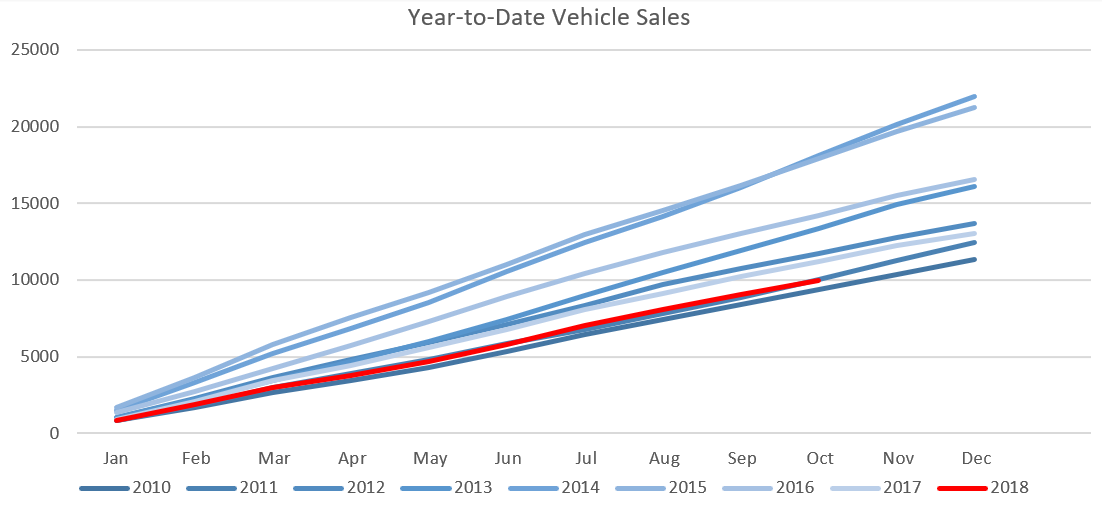
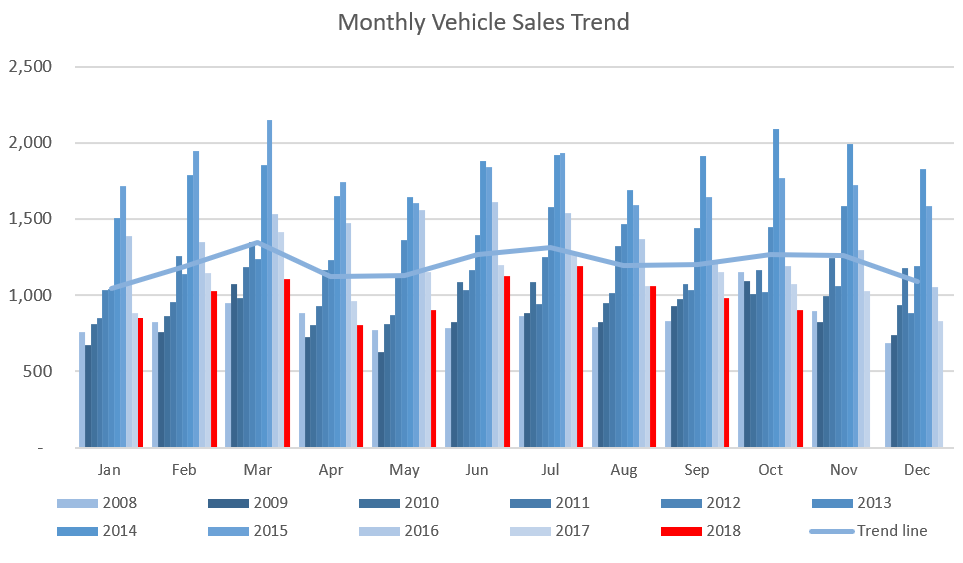
905 New vehicles were sold in October, representing a 7.8% decrease from the 982 vehicles sold in September, and an 8.7% decrease from October 2017 when 991 new vehicles were sold. Year-to-date 9,957 vehicles have been sold of which 4,361 were passenger vehicles, 5,049 light commercial vehicles, and 547 medium and heavy commercial vehicles. On a twelve-month cumulative basis, a total of 11,793 new vehicles were sold as at 31 October 2018, which represents a contraction of 13.1% from the 13,565 sold over the comparable period a year ago. New vehicle sales are thus still in decline despite the low base set in 2016 and 2017.

A total of 399 new passenger vehicles were sold during October, increasing by 19.8% m/m but declining by 2.0% y/y. Year-to-date passenger vehicle sales rose to 4,361, down 8.3% y/y. On a rolling 12-month basis new passenger vehicle sales were down 47.8% from the peak in April 2015.

Commercial vehicle sales reflect a similar picture, declining by 13.4% year-to-date and 15.4% y/y on a rolling 12-month basis. A total of 506 new commercial vehicles were sold in October, representing a contraction of 22.0% m/m and 13.4% y/y. 442 Light commercial vehicles, 18 medium commercial vehicles, and 46 heavy commercial vehicles were sold during the month. Light commercial vehicle sales have dropped 16.8% y/y, while medium commercial sales rose 5.9% y/y, and heavy and extra heavy sales rose by 27.8% y/y. On a twelve-month cumulative basis, light commercial vehicle sales dropped 16.9% y/y, while medium commercial vehicle sales rose 0.83% y/y, and heavy commercial vehicle sales rose 0.2% y/y. This is the first month since November 2015 that medium commercial sales have showed positive growth on a twelve-month cumulative basis, and the first month since February 2016 that heavy commercial sales have showed positive growth on a twelve-month cumulative basis. The positive growth is negligible at this point but it is possible that a floor in medium and heavy commercial vehicle sales has been found as companies that have been sweating assets start to replace those vehicles.

Toyota continues to lead the market for new passenger vehicle sales in 2018 based on the number of new vehicles sold, claiming 34.2% of the market, followed by Volkswagen with a 28.2% share. They were followed by Hyundai and Kia at 5.8% and 4.8% respectively, while the rest of the passenger vehicle market was shared by several competitors.

Toyota also remained the leader in the light commercial vehicle space with a 57.8% market share, with Nissan in second place with a 17.3% share. Ford and Isuzu claimed 8.5% and 5.0%, respectively, of the number of light commercial vehicles sold thus far in 2018. Hino leads the medium commercial vehicle category with 42.4% of sales while Scania remains number one in the heavy and extra-heavy commercial vehicle segment with 36.8% of the market share year-to-date.

The Bottom Line

The cumulative number of new vehicle sales continued to contract on a 12-month basis, amounting to 11,793 at the end of October. Government’s continued commitment to fiscal consolidation does have a direct effect on the demand for new vehicles. Government vehicle expenditure has fallen from N$1.02 billion in the 2014/15 fiscal year to N$22.2 million in 2017/18. In his Mid-Term Budget Review Speech last month, finance minister Calle Schlettwein left the revised vehicle budget unchanged at N$11.9 million from the budget tabled in March. N$1.4 million is allocated to the Auditor General’s office for vehicles, N$10.0 million to Health and Social Services and N$500,000 to the Justice ministry. For the 2019/20 year, N$10.0 million is allocated to Health and Social Services for vehicles. These figures dim the prospects for new vehicle sales in the short- to medium-term.

PSCE – September 2018

Overall

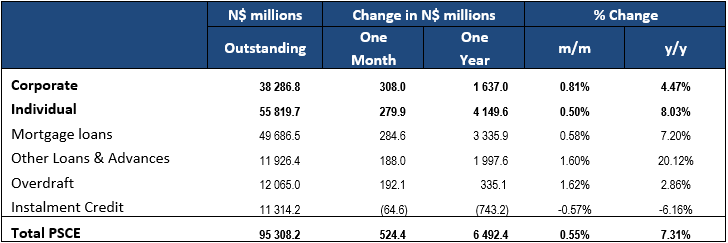
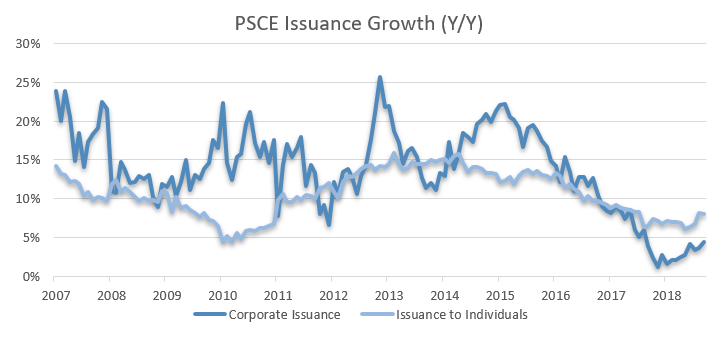
Private sector credit extension (PSCE) rose by N$524.4 million or 0.6% m/m, compared to the N$1.375 billion or 1.5% m/m increase recorded in August. PSCE growth ticked up marginally to 7.3% y/y in September from 7.1% y/y in August. Cumulative credit outstanding currently amounts to N$95.3 billion. Similar to what transpired in August, the monthly increase in PSCE for September was driven by corporates rather than households. On an annual basis PSCE growth was largely driven by household demand for credit. Growth in credit extended to households however, did slow marginally to 8.0% y/y in September compared to 8.1% y/y in August. Credit extended to corporates increased by 4.5% y/y in September following a 3.6% y/y rise in August. On a rolling 12-month basis N$6.49 billion worth of credit was extended to the private sector with N$4.15 billion being taken up by households. Corporations took up N$1.64 billion worth of credit while claims on non-residents totaled N$705.8 million.

Credit extension to individuals

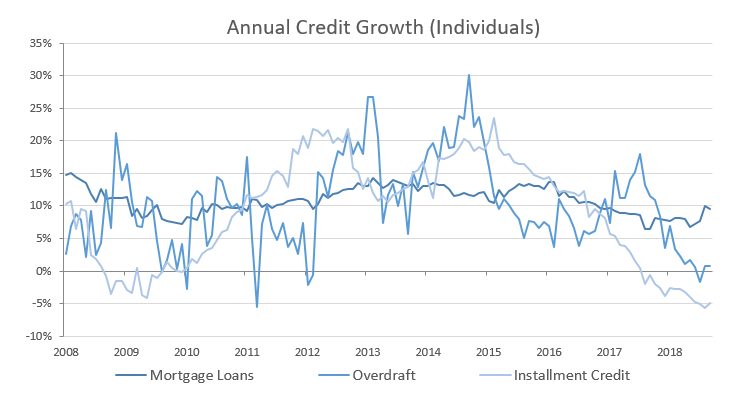
Credit extended to individuals increased by 8.0% y/y in September, almost unchanged from the 8.1% y/y growth recorded in August. Mortgage loans extended to individual increased by 9.5% y/y in September compared to the 10.0% y/y increase recorded in August.  Other loans and advances grew by 18.0% y/y and 1.6% m/m in September. Growth in installment credit remained in negative territory, contracting by 4.6% y/y and 0.2% m/m in September. Household demand for overdraft facilities remained subdued in September, increasing by 0.8% y/y and unchanged on a month-on-month basis.

Credit extension to corporates

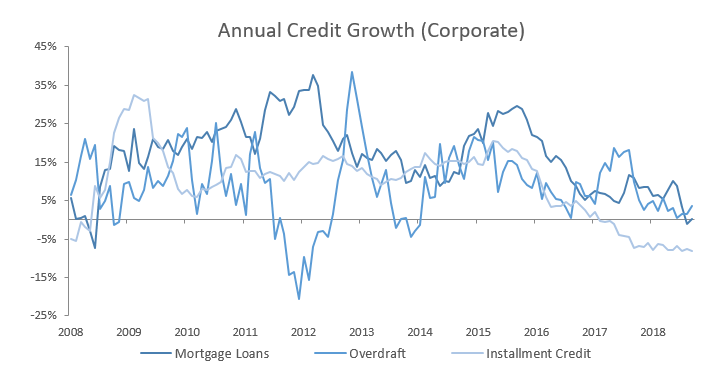
Credit extension to corporates grew by 4.5% y/y and 0.8% m/m in September. On a rolling 12-month basis N$1.64 billion was extended to corporates as at the end of September compared to N$1.34 billion as at the end of August. The uptick in the general demand for credit by corporates does provide for some optimism, possibly showing signs of increased business confidence. However, the biggest driver of the increase in credit extended to corporates was a 22.4% y/y increase in loans and other advances, followed by overdraft facilities increasing by 3.6% y/y. The continued contractions in installment credit and leasing transactions of 8.0% y/y and 1.6% y/y respectively, is a sign of declining capital investment. When viewed in conjunction with in the increased use of short-term credit such as overdraft facilities, this points to businesses borrowing to manage cash flows rather than expanding operations.


Banking Sector Liquidity

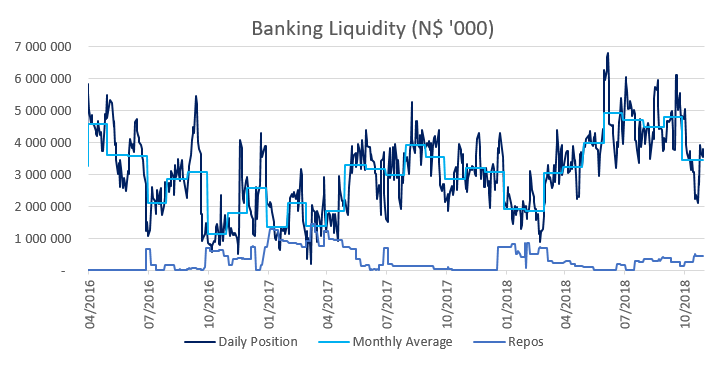
The overall liquidity position of commercial banks increased by N$303.1 million to an average of N$4.8 billion during September from N$4.5 billion in August. Bank of Namibia attributed the strong liquidity in September to an increase in Diamond sales. Furthermore, commercial banks made less use of BoN’s repo facility, with the outstanding balance of repo’s decreasing from N$386 million at the start of September to N$147 million by month end. The balance of BoN bills remained unchanged at N$1.7 billion as at the end of September.


Reserves and money supply

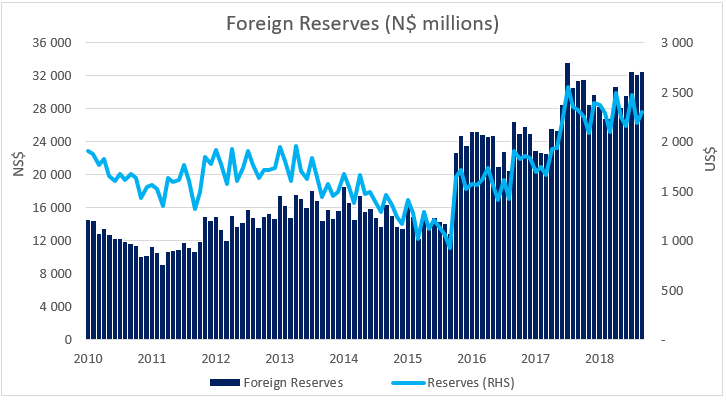
Foreign reserve balances increased by N$321 million to N$32.52 billion in September from N$32.20 billion in August. BoN attributes the increase in reserves to inflows from foreign currency deposits by the commercial banks. A portion of the foreign currency deposits are attributable to diamonds sales which also led to the increased liquidity position as noted above.

Outlook

PSCE accelerated moderately for a second consecutive month, reaching a 16-month high growth rate of 7.3% y/y. Much of the rise in PSCE was household driven over the last year. One would expect for the increase in household demand to translate into an increase in business credit to meet that demand. However, corporates have scaled down in their uptake of mortgage financing and installment credit, which finances capital projects. This becomes concerning when viewed in conjunction with loans, advances and overdrafts that have been on the rise and does point to businesses operating under difficult financial conditions. October and November PSCE releases may record increases in short-term credit extended to corporates, as businesses prepare for the seasonal uptick in retail spending expected over the last two months of the year.

Key monetary policy decisions are scheduled between now and December that will have an impact on PSCE growth in the near-term. The SARB Monetary Policy Committee (MPC) will meet in November to re-evaluate interest rates, with present expectations of a 25bp hike in rates. A SARB rate hike will put SA’s repo rate on par with that of Namibia. BoN’s MPC, scheduled to meet in December, would be likely to seriously consider maintaining the 25bp interest rate spread over South Africa which would see a similar rate hike in Namibia. At present, South African money market rates are marginally higher than those in Namibia, and if BoN keeps its repo rate on par with that of SA, it may lead to an outflow of capital from Namibia. A rate hike by BoN would mitigate the risk of capital outflows and protect foreign reserve levels, but will make debt service costs more expensive for an already indebted consumer.