700 New vehicles were sold in December, 1 more than the upward revised 699 in November, but a 2.0% y/y decrease from the 714 new vehicles sold in December 2019. Year-to-date 7,614 vehicles have been sold, a 26.8% contraction from December last year and the lowest annual vehicle sales figure since 2004. Of the 7,614 new vehicles sold during the year, 3,212 were passenger vehicles, 3,869 were light commercial vehicles, and 533 were medium and heavy commercial vehicles.

A total of 330 new passenger vehicles were sold during December, representing a 2.9% m/m contraction, but a 5.1% y/y increase. 3,212 passenger vehicles were sold in 2020, a 29.4% decline from 2019 and lower annual sales than the preceding 16 years. Passenger vehicle sales made up 42.2% of the total number of new vehicles sold during 2020 broadly in line with the trend over the last 6 years.

370 new commercial vehicles were sold in December, an increase of 3.1% m/m, but a 7.5% y/y contraction. During the month 315 light commercial vehicles, 13 medium commercial vehicles, and 42 heavy commercial vehicles were sold. On a year-on-year basis, light commercial sales have declined by 6.0%, medium commercial vehicles fell 38.1% and heavy and extra heavy vehicles sales contracted 4.5%. On a twelve-month cumulative basis, light commercial vehicle sales dropped 24.2% y/y, medium commercial vehicle sales fell 35.3% y/y and heavy commercial vehicle sales contracted by 25.4%.

Toyota lead the market for new passenger vehicle sales in 2020, claiming 28.6% of the market, followed by Volkswagen with a 25.5% share. They were followed by Kia and Hyundai at 6.8% and 5.8%, respectively. The only other manufacturer that managed to breach the 5% market share mark was Mercedes-Benz with 5.3% of the market, leaving the remaining 27.9% of the market to other brands.

Toyota also remained the leader in the light commercial vehicle space in 2020 with 56.0% market share, with Nissan in second place with a 12.9% market share. Ford and Isuzu claimed 12.3% and 6.7% respectively of the number of new light commercial vehicles sold for the year. Mercedes lead the medium commercial category with 32.0% of sales while Volvo Trucks was number one in the heavy and extra-heavy commercial vehicle segment with 21.6% of the market share during the year.
The Bottom Line
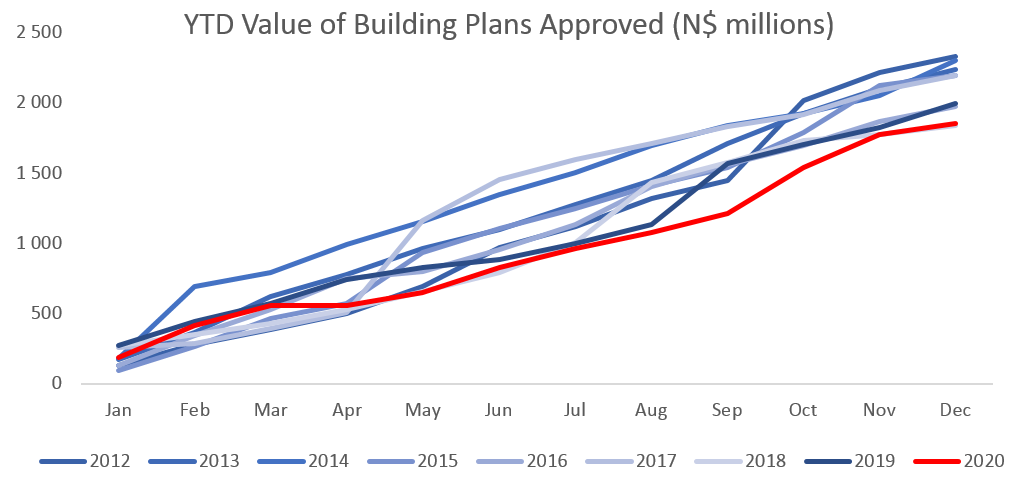
2020 was a dismal year for vehicle sales. The cumulative number of new vehicle sales for the year amounted to 7,614, a decline of 26.8% from the cumulative number of vehicles sold in 2019 and a 66.4% contraction from the peak of 22,664 new vehicle sales recorded in April 2015 on a cumulative 12-month basis. The year-to-date sales graph at the top of this report shows how severely the new vehicle industry was impacted by the lockdown in April. The recovery since then has been slow and overall new vehicle sales have still not returned to the already low levels of 2019. The introduction of the longer-dated 72-month vehicle loans has had a small positive impact on new passenger vehicle sales, but not enough to offset the damage done by lockdowns. With there being few signs that 2021 will see significant economic growth, we expect new vehicle sales to remain under pressure.