Twitter Timeline
Twitter feed is not available at the moment.Categories
- Calculators (1)
- Company Research (281)
- Capricorn Investment Group (48)
- FirstRand Namibia (51)
- Letshego Holdings Namibia (23)
- Mobile Telecommunications Limited (6)
- NamAsset (3)
- Namibia Breweries (45)
- Oryx Properties (55)
- Paratus Namibia Holdings (5)
- SBN Holdings Limited (15)
- Economic Research (558)
- BoN MPC Meetings (4)
- Budget (19)
- Building Plans (119)
- Inflation (121)
- Other (27)
- Outlook (17)
- Presentations (2)
- Private Sector Credit Extension (119)
- Tourism (4)
- Trade Statistics (2)
- Vehicle Sales (122)
- Media (25)
- Print Media (15)
- TV Interviews (9)
- Regular Research (1,358)
- Business Climate Monitor (75)
- IJG Daily (1,168)
- IJG Elephant Book (12)
- IJG Monthly (101)
- Team Commentary (239)
- Danie van Wyk (60)
- Dylan van Wyk (27)
- Eric van Zyl (16)
- Hugo van den Heever (1)
- Leon Maloney (11)
- Top of Mind (4)
- Zane Feris (2)
- Uncategorized (2)
- Valuation (3,232)
- Asset Performance (94)
- IJG All Bond Index (1,408)
- IJG Daily Valuation (1,338)
- Weekly Yield Curve (391)
Meta
Category Archives: Economic Research
New Vehicle Sales – May 2019
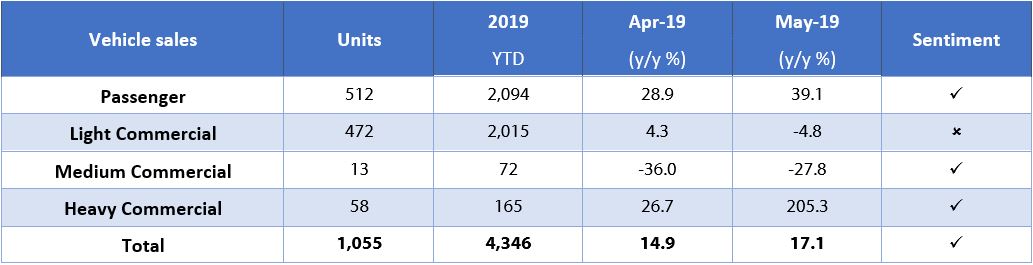
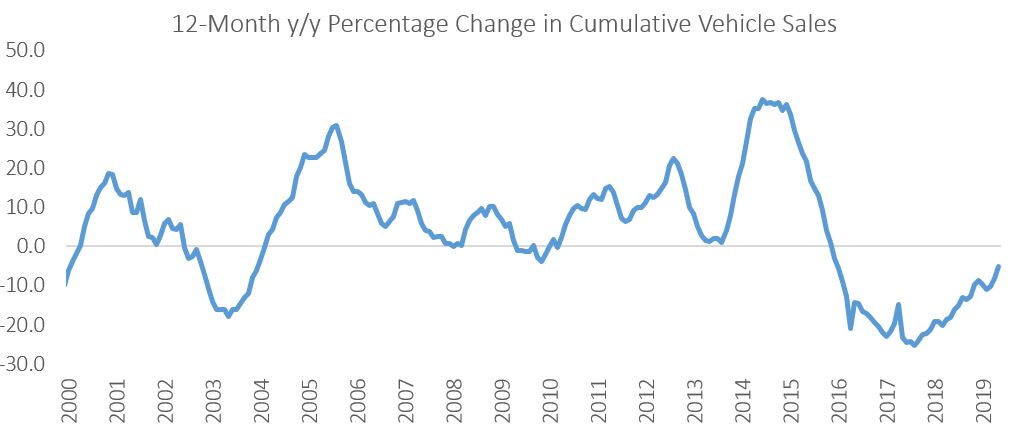
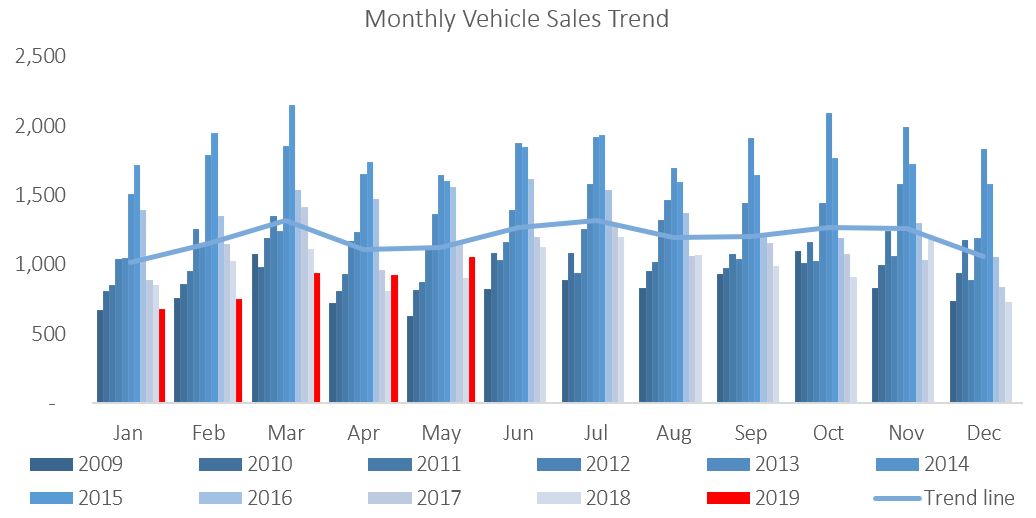
A total of 1,055 new vehicles were sold in May, a 13.9% m/m increase from the 926 vehicles sold in April. Year-to-date, 4,346 vehicles have been sold of which 2,094 were passenger vehicles, 2,015 were light commercial vehicles, and 237 were medium and heavy commercial vehicles. On a twelve-month cumulative basis, new vehicle sales increased by 1.4% m/m to 11,559 new vehicles sold as at the end of May 2019. On an annual basis, twelve-month cumulative new vehicle sales continued on a downward trend, contracting by 5.0% from the 12,172 new vehicles sold over the comparable period a year ago.
512 New passenger vehicle sales were sold in May, an increased by 10.3% m/m and 39.1% y/y. Year-to-date, passenger vehicle sales rose to 2,094 units, reflecting lower cumulative sales than the preceding 8 years, and a 2.2% decline from the year-to-date figure recorded in May 2018. Twelve-month cumulative passenger vehicle sales rose 2.9% m/m, but continued to slide on an annual basis, contracting by 1.8% y/y.
A total of 543 new commercial vehicles were sold in May, 17.5% more than in April and 1.9% more than in May 2018. Of the 543 commercial vehicles sold in May, 472 were classified as light commercial vehicles, 13 as medium commercial vehicles and 58 as heavy or extra heavy commercial vehicles. On a twelve-month cumulative basis, light commercial vehicle sales dropped 8.9% y/y, while medium commercial vehicle sales rose 2.3% y/y, and heavy commercial vehicle sales rose by 9.0% y/y. Medium and heavy commercial vehicle sales seem to have quelled the downward trend on a twelve-month cumulative basis. Medium commercial vehicle sales have registered modest growth by this measure for 8 consecutive months now, while heavy commercial vehicle sales have posted growth for the first time since early 2016.
Volkswagen leads the passenger vehicle sales segment with 33.4% of the segment sales thus far in 2019. Toyota retained second place with 30.2% of the market-share as at the end of May. Kia, Hyundai, Mercedes round out the top selling brands in the segment with 5.2%, 4.8% and 4.7% market share year-to-date. This leaves the remaining 21.7% of the market to other brands.
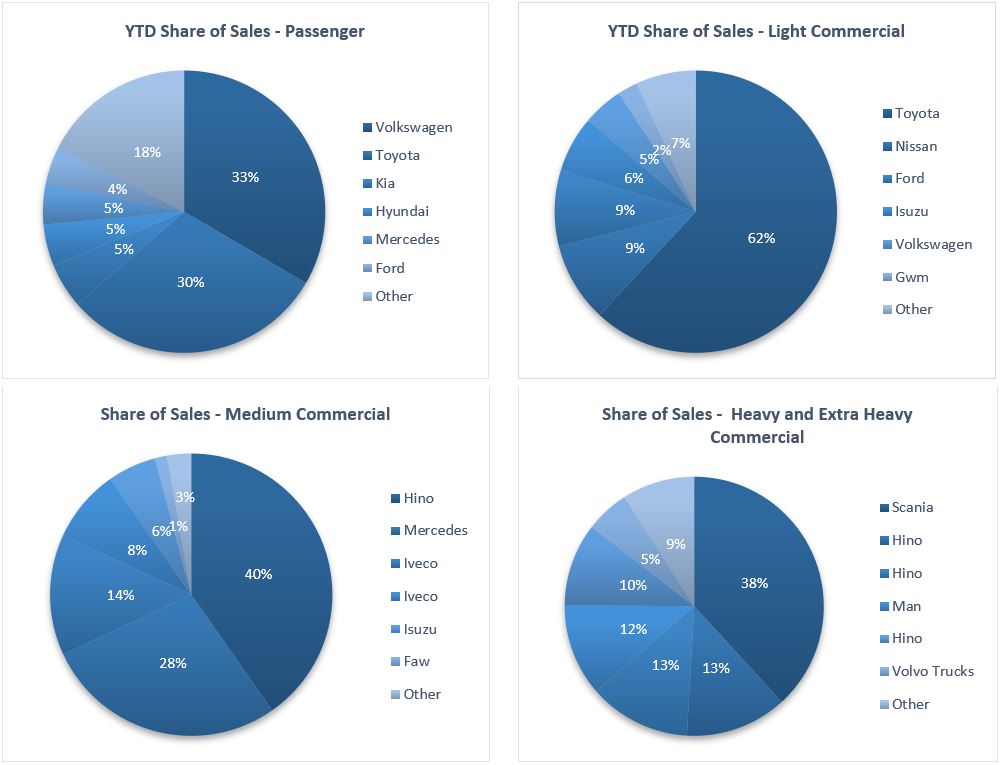
Toyota remained the best-selling brand in the light commercial vehicle sales segment with 61.9% of the market share year-to-date. Ford drops to third place in the segment with 8.7% of the market share after being displaced by Nissan with 9.1% of the year-to-date sales. Hino leads the medium commercial vehicle segment with 40.3% of sales year-to-date, while Scania was number one in the heavy and extra-heavy commercial vehicle segment with 38.2 of the market share year-to-date.
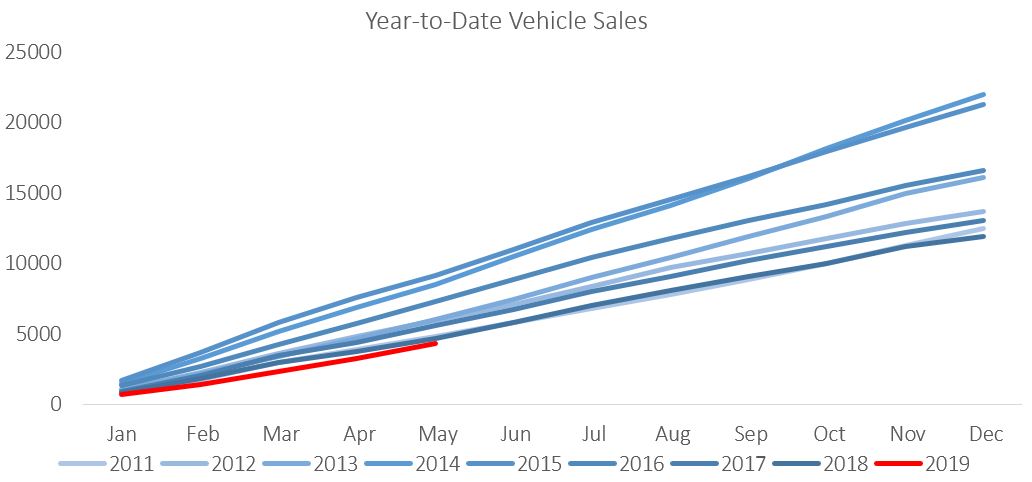
The Bottom Line
Vehicle sales remain under pressure as is evident in the figures below. Year-to-date new vehicle sales in 2019 are currently below 2011 levels, reflective of depressed business and consumer confidence. Total new vehicle sales for the last 12 months is 49% down from peak levels seen in 2015. Vehicle sales is a lagging economic indicator and thus tells us little about what to expect going forward, but illustrates the extent of the downturn we have been through thus far.
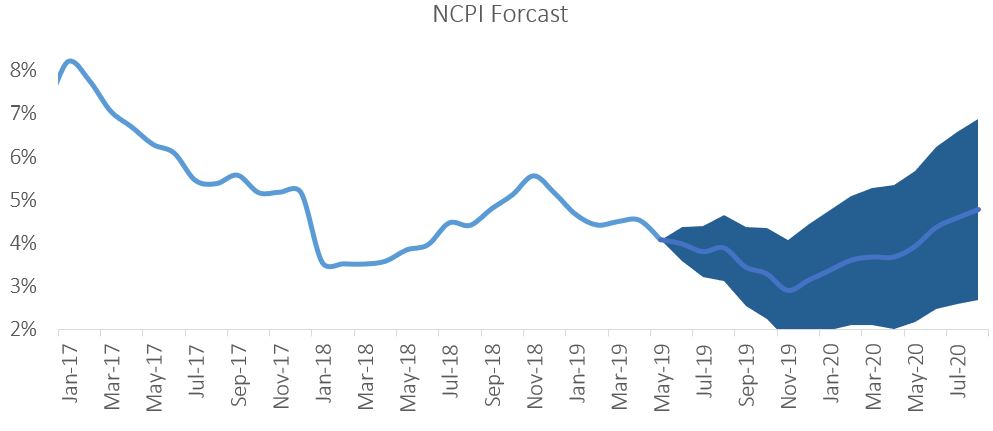
NCPI – May 2019
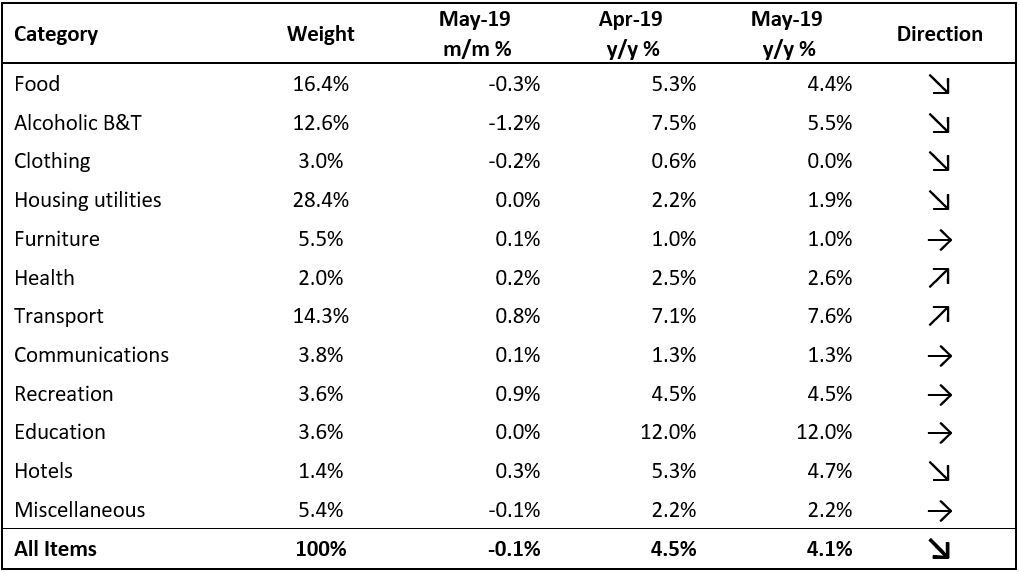
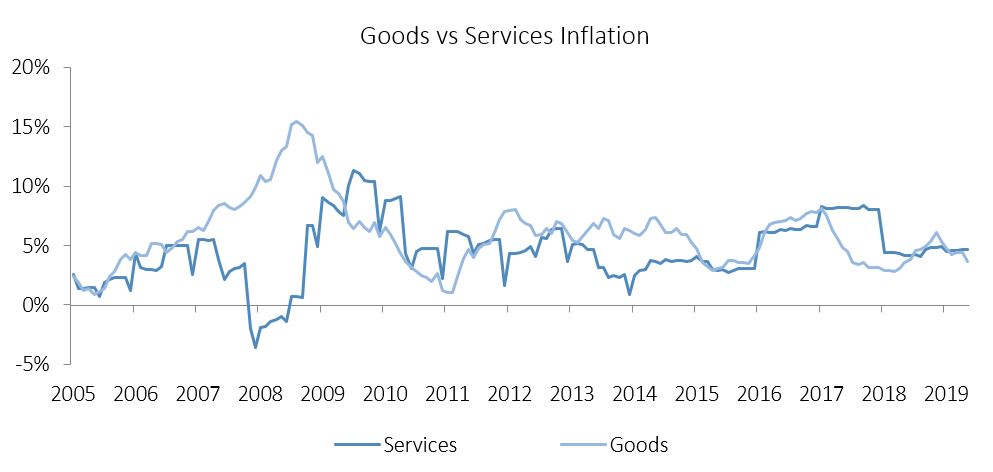
The Namibian annual inflation rate slowed to 4.1% y/y in April, from 4.5% in March. On a month-on-month basis prices decreased by 0.1%, following the 0.4% m/m increase in April. Overall, prices in only two of the basket categories rose at a faster annual rate than in April, price in five categories rose at a slower annual rate and five categories recorded steady inflation rates. Prices for goods rose by 3.7% y/y in May, while prices for services grew by 4.6% y/y.
The transport basket was the largest contributor to annual inflation in May. Prices in the transport basket rose 0.8% m/m and 7.6% y/y during the month, reflecting the increase in fuel prices and taxi fares respectively. The cost of purchasing motor vehicles dropped by 1.0% m/m in May, with annual growth in vehicle prices recorded subdued growth of 4.1%. The cost of public transportation services has risen by 20.0% when compared to May last year, due to the increase in taxi fares in September. The operation of personal transport equipment, largely made up of fuel expenses, costs 1.9% more than in April, and 5.7% more than in May 2018.
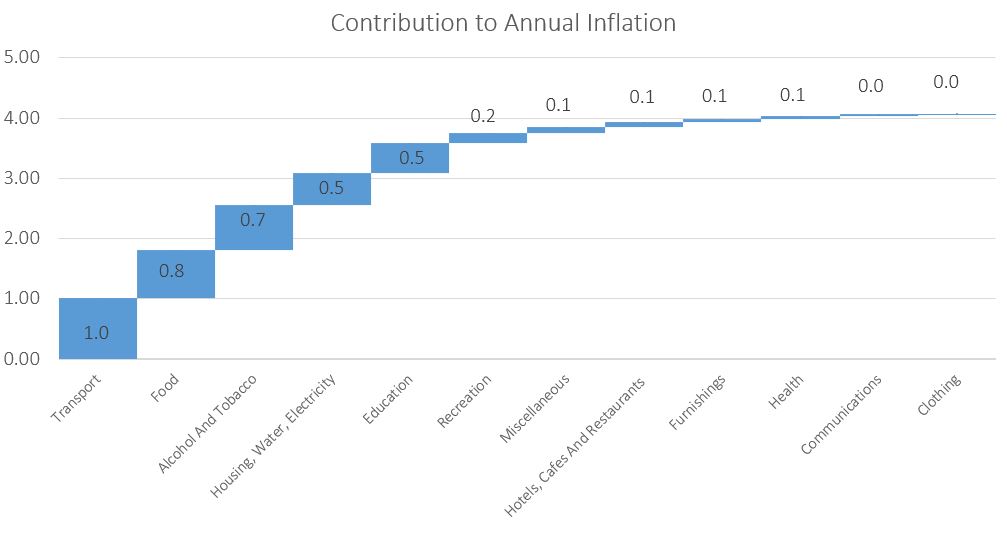
Food and non-alcoholic beverages prices decreased by 0.3% m/m, although this basket of goods costs 4.4% more than it did last year. Despite this relatively subdued rate of annual inflation and contraction on a monthly basis, this basket category made up the second largest portion of annual inflation. The meat prices subcategory recorded price decreases of 1.7% m/m and 0.4% y/y, meaning that meat is cheaper on average than it was last month and in May last year. The decline in meat prices is not expected to last however, as it is largely driven by high supply of animals as farmers slaughter more during the drought. Restocking farms in the future will likely lead to upward pressure on meat prices. Fish prices saw even larger decrease in May, recording deflation of 5.0% m/m and 1.4% y/y.
Alcohol and tobacco prices decreased by 1.2% in May with annual price inflation in this basket category slowing to 5.5% from 7.5% in April. Tobacco prices recorded a decrease of 7.8% m/m and 3.4% y/y and thereby caused the slowdown in inflation in the overall category. This is very puzzling and no explanation for this decrease in prices is given by the NSA in its bulletin. Market dynamics have seen above average increases in the prices of tobacco products in recent years in order to maintain revenues as cigarette use declines. Prices for alcoholic beverages continued their upward trend in May, recording inflation of 0.3% m/m and 7.6% y/y.
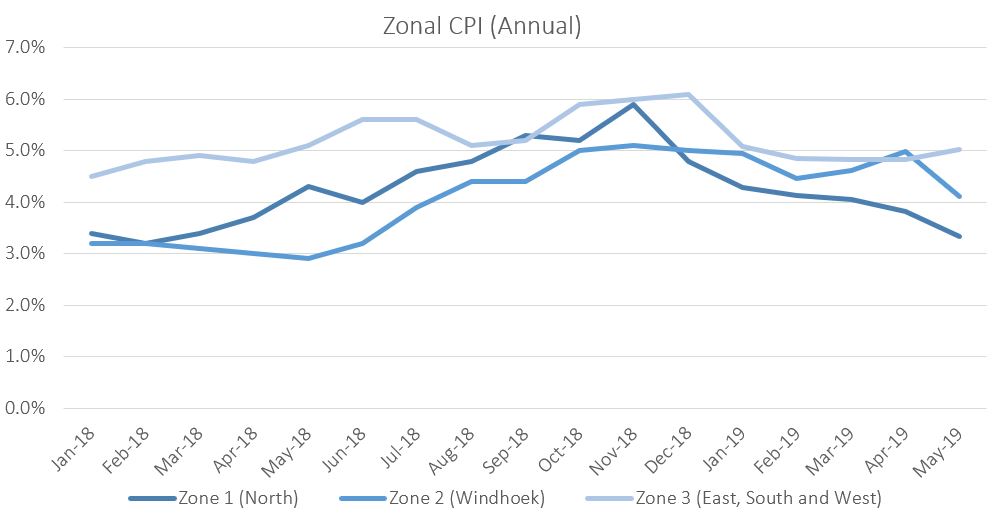
The Namibia Statistics Agency (NSA) released regional CPI data for Namibia for the first time in April, grouping the country into three zones, based on the then Central Bureau of Statistics’ (CBS) 2005 grouping. Zone 1 consists of regions in the northern part of the country, namely Kavango East, Kavango West, Kunene, Ohangwena, Omusati, Oshana, Oshikoto, Otjozondjupa and Zambezi. Zone 2 covers the Khomas region and Zone 3 covers the remaining //Karas, Erongo, Hardap, and Omaheke regions. This zonal data shows that on a monthly basis prices decreased in the central zone 2 while rising elsewhere in the country. On an annual basis the northern regions, in zone 1, recorded the lowest inflation rate at 3.3%, with the mixed zone 3 covering the east and west of the country recording the highest rate of inflation at 5.0%. Prices in zone 2 (Windhoek and surrounds) increased by 4.1% y/y.
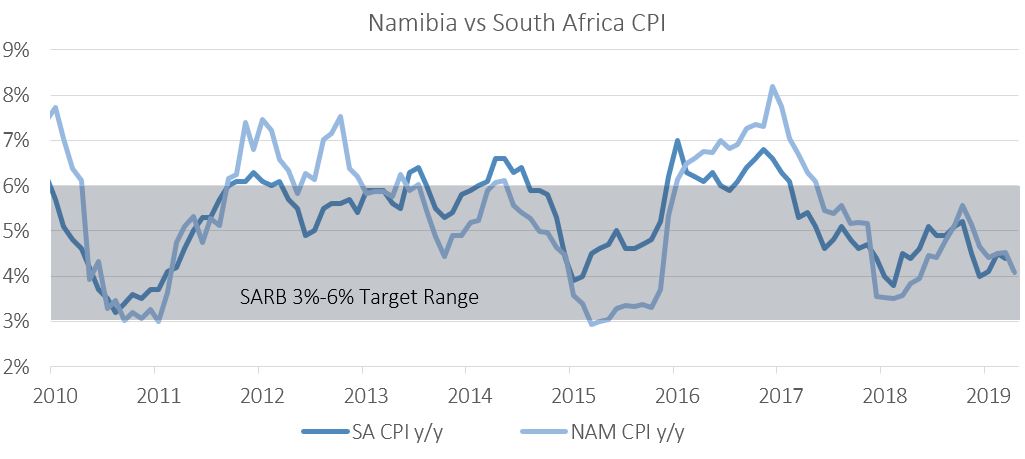
Low food price inflation and subdued housing and related inflation rates have contributed greatly to the low overall inflation figure in May. The moderate food price inflation comes as some relief to struggling households in the current economic climate. Aggregate demand in the Namibian economy remains depressed despite accommodative interest rates. Low aggregate demand is indeed responsible for much of the low price inflation experienced at present. Generally, depressed aggregate demand this is countered with monetary policy through interest rate cuts. This is however not an option for the Bank of Namibia (BoN) at present as decreasing rates to below those in neighbouring South Africa may put pressure on the reserve position and by extension the currency peg. As such monetary policy is currently restricted to what the South African Reserve Bank (SARB) implements across the border.
The SARB, expected to keep rates on hold for 2019 at the beginning of the year, is taking an ever more dovish tone as the year progresses. The last SARB monetary policy committee (MPC) decision was split 3:2 between members wanting to keep rates on hold and those calling for a cut, respectively. The market now expects two rate cuts of 25 basis points in South Africa in 2019. Should the SARB cut rates we believe that BoN will follow, bringing some relief to Namibian borrowers.
We do however not believe that a 50 basis point decrease in interest rates in Namibia will be enough to drive meaningful economic growth in the current policy environment. The policy uncertainty created over the last three years, combined with impending tax amendments, make the business climate in Namibia less conducive to growth and employment creation. In this environment monetary policy is likely to be less effective than during a growth slowdown free of these impediments to growth. Policy clarity thus remains the strongest tool available to government to turn around the Namibian economy.