Building Plans – June 2019

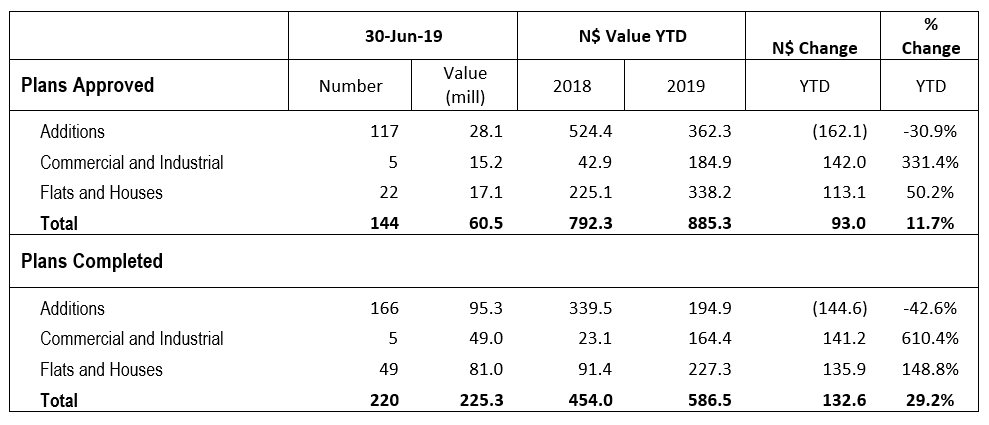
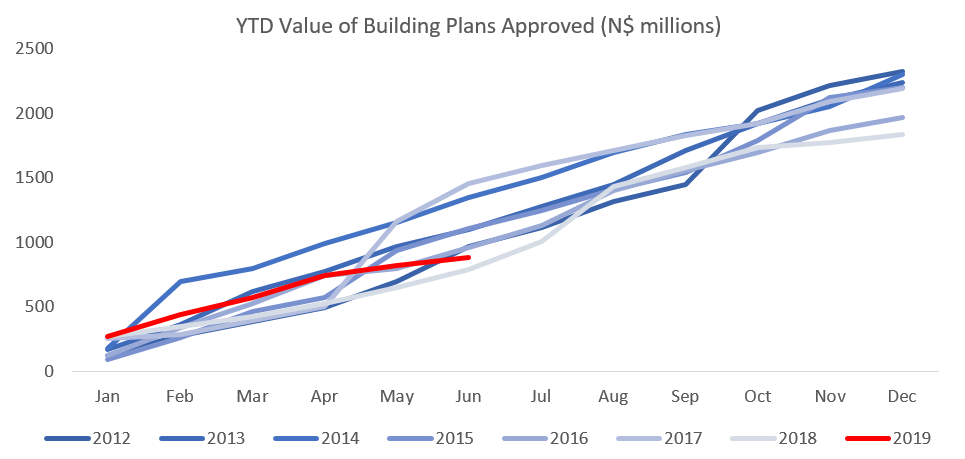
A total of 144 building plans were approved by the City of Windhoek in May, 15 less than in May. N$60.5 million worth of plans were approved in June as opposed to N$81.3 million in May. A total of 220 building plans were completed during the month with a value of N$225.3 million. Year-to-date, N$885.3 million worth of building plans have been approved, 11.7% more than during the corresponding period in 2018. On a twelve-month cumulative basis, 2,108 building plans have been approved worth approximately N$1.93 billion, 26.6% higher in value terms than cumulative approvals in June 2018.

117 additions to properties were approved in June with a value of N$28.1 million, a drop of 17.5% m/m and 63.8% y/y in value. Year-to-date 760 additions to properties have been approved with a total value of N$362.3 million, decreases of 1.3% y/y in number and 30.9% y/y in value terms. On a 12-month cumulative basis the number of additions approved has decreased by 0.8% y/y as well as by 22.2% y/y in value terms. We continue to see more additions to properties being approved but with a lower overall value being added.  Year-to-date 341 additions have been completed with a combined value of N$194.9 million, down 68.3% y/y in number and 42.6% y/y in value terms.

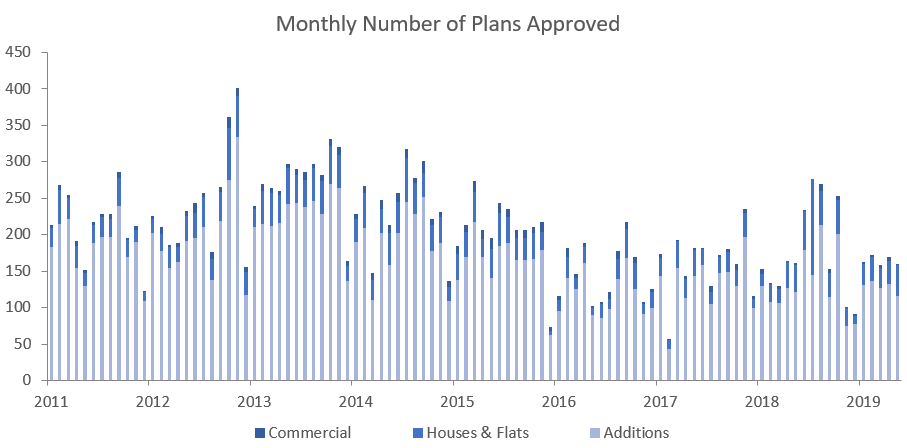
New residential units accounted for 22 of the approvals registered in June, decreases of 47.6% m/m and 58.5% y/y. In value terms N$17.2 million worth of residential units were approved in June, contracting by 62.7% m/m and 68.0% y/y. Year-to-date residential unit approvals have decreased by 0.5% y/y in number and are up 50.2% y/y in value. On a 12-month cumulative basis residential unit approvals recorded a 50.6% y/y increase in number of approvals and a 76.9% y/y increase in value.

5 new commercial units valued at N$15.2 million were approved in June, bringing the year-to-date number of commercial and industrial approvals to 20, worth a total of N$184.9 million. This is 5.3% up in number from June last year and 331.4% up in value terms. On a rolling 12-month basis the number of commercial and industrial approvals have risen to 44 units worth N$522.3 million. This is a decrease of 15.4% y/y in number but an increase of 192.0% y/y in value.

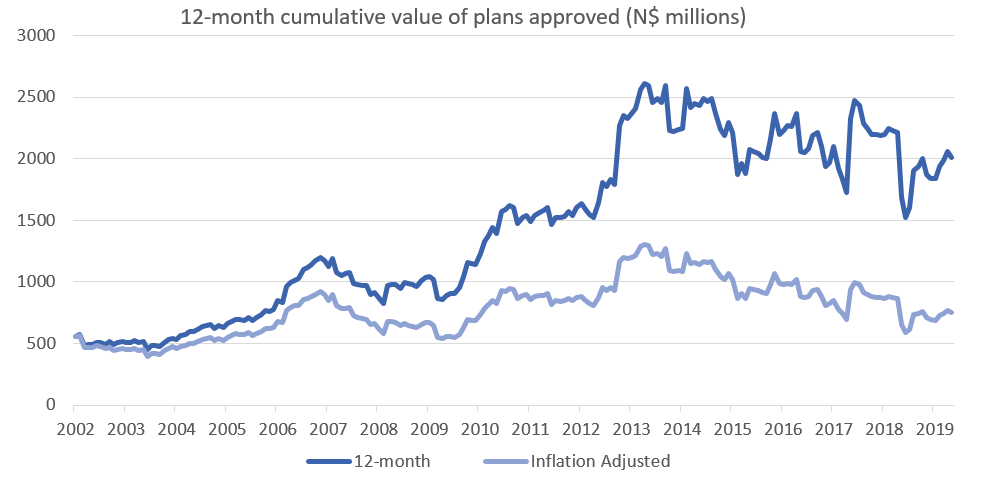
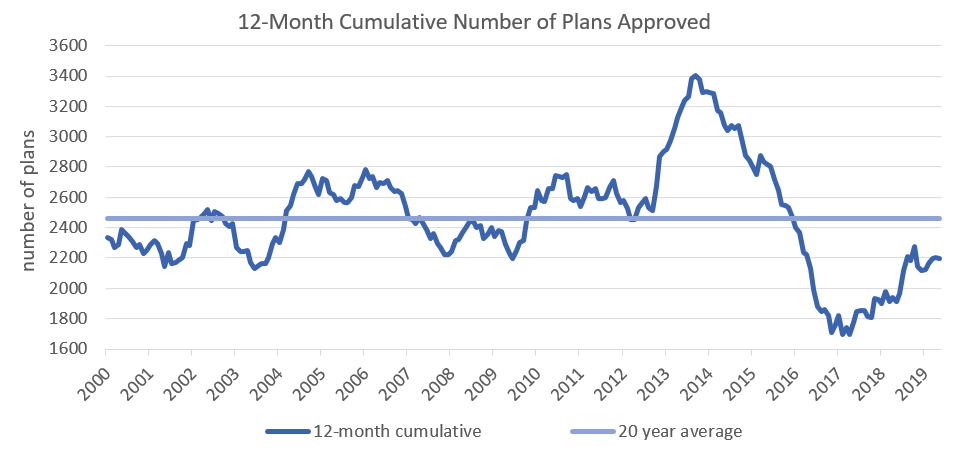
In the last 12 months 2,108 building plans have been approved, increasing by 7.1% compared to June 2018. These approvals are valued at N$1.93 billion, an increase of 26.6% y/y. Overall the cumulative plans approved have increased in number and value terms compared to a year ago which points to positive future construction activity in the city.

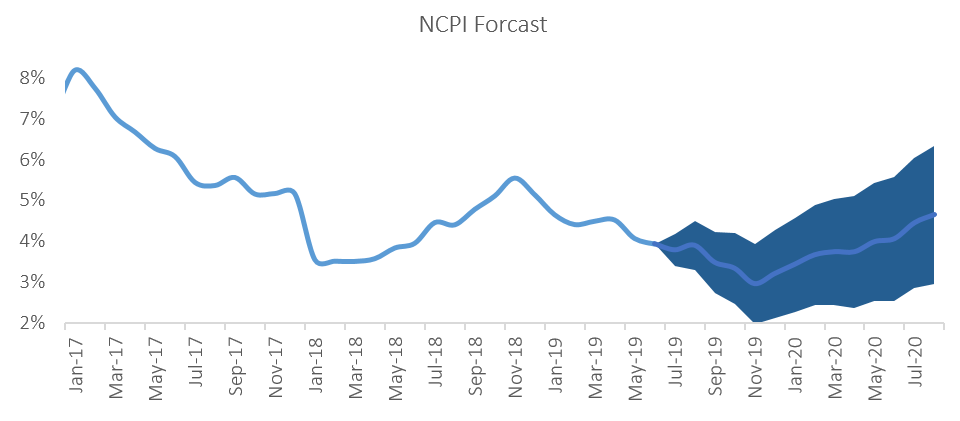
Our expectation is for the Bank of Namibia to follow the SARB’s MPC decision to cut interest rates by 25 bps at next month’s MPC meeting. Consumers and businesses are thus likely to be provided with some slight relief. With the rate cut it will become more attractive for businesses to acquire the debt finance needed to expand and invest in capital projects, but only marginally.

Interest rates are unlikely to be the major barrier to capital projects going forward. The construction industry, along with lenders, have been challenged by sluggish growth in the economy and poor business confidence rather than tight monetary policy. We do not expect the decrease in interest rates to bring about a significant improvement in the approvals and completions data in the short term as business confidence is still lacking.


NCPI – June 2019

The Namibian annual inflation rate moderated to 3.9% y/y in June, following the 4.1% y/y increase in prices recorded in May. Prices increased by 0.1% m/m, compared to the overall basket price decrease of 0.1% m/m in May. Overall, prices in four of the basket categories rose at a faster annual rate than in May, prices in five categories rose at a slower annual rate and three categories recorded steady inflation rates. Prices for goods rose by 3.4% y/y in June, while prices for services rose by 4.7%.

Transport accounted for 1.0 of the total 3.9% annual inflation recorded in June, making it the largest contributor to annual inflation for the month. Prices in the transport basket rose 1.1% m/m and 7.0% y/y. The purchase of vehicles subcategory saw price decreases of 0.5% m/m and 3.6% y/y. The operation transport equipment subcategory recorded price increases of 2.0% m/m and 5.0% y/y. The Ministry of Mines and Energy announced an increase in fuel pump prices of 30 c/l on all controlled products at the beginning of June.

In order to stabilise fuel prices, the Ministry decided not to pass on over-recoveries to the consumer, and kept pump prices unchanged. Brent Crude oil prices increased by 3.2% during June, reaching US$66.55 per barrel at the end of the month and the National Energy Fund saw it prudent to strengthen its financial position given the potential risks of further increases in the Brent Crude prices, citing political tension between USA and Iran specifically.

Alcohol and tobacco prices were flat on a month-on-month basis, but increased 5.5% y/y. The upward movement year-on-year resulted from increases in prices for the alcoholic beverages sub-component. Prices of alcoholic beverages, decreased by 0.2% m/m but increased by 7.9% y/y. However, tobacco prices recorded an increase of 0.8% m/m but decreased by 4.7% y/y.

Food & non-alcoholic beverages, the second largest basket item by weighting, was the second largest contributor to annual inflation, accounting for 0.7 of the 3.9% annual inflation rate. Prices in this category decreased by 0.4% m/m but rose by 3.9% y/y. Prices in ten of the thirteen sub-categories recorded increases on annual basis, with the largest increases being observed in the prices of bread and cereals, and fruits and vegetables.

The increase on an annual basis is likely of the second-round effects of increased transport prices which has filtered through to food prices, coupled with poor rainfall during Namibia’s rainy season that affects local food production.

Zonal data shows that on a monthly basis prices were flat in the central zone 2 while rising elsewhere in the country. On an annual basis the northern regions, in zone 1, recorded the lowest inflation rate at 3.5%, with the mixed zone 3 covering the south, east and west of the country recording the highest rate of inflation at 4.9%. Inflation in zone 2 (Windhoek and surrounding) moderated to 3.7% y/y.

The Namibian annual inflation rate of 3.9% y/y for June is lower than that of neighbouring South Africa’s 4.5% y/y for May. South Africa is yet to announce the June inflation rate, but thus far inflation outcome has been within the 3-6% inflation target. Due to a deteriorating growth outlook for South Africa, as well as the SARB’s latest inflation forecasts, we expect the SARB’s MPC to announce a 25bp rate cute later this week. We believe that the more dovish outlook by central banks in advanced economies gives the SARB enough room to cut rates, with the Bank of Namibia likely to follow suit at its next MPC meeting in August.  IJG’s inflation model forecasts an average inflation of 3.9% y/y in 2019. The largest upside risk to this forecast, is higher transport and food costs and the upper band of 4.3% currently looks more likely.


New Vehicle Sales – June 2019

A total of 977 new vehicles were sold in June, representing a 7.4% m/m decrease from the 1,055 vehicles sold in May. Year-to-date, 5,323 vehicles have been sold of which 2,472 were passenger vehicles, 2,534 were light commercial vehicles, and 317 were medium and heavy commercial vehicles. On a rolling 12-month basis a total of 11,412 new vehicles were sold as at June 2019, representing a contraction of 5.7% from the 12,100 sold over the comparable period a year ago.

378 New passenger vehicles were sold in June, declining by 26.2% m/m and 18.0% y/y. Year-to-date passenger vehicle sales rose to 2,472 units, down 5.0% when compared to the number sold in the first half of last year. Twelve-month cumulative passenger vehicle sales fell 1.6% m/m and 2.4% y/y. Passenger vehicles have made up 46.4% of the total number of new vehicles sold in the first six months of 2019, compared to 44.7% in the same period last year.

A total of 599 new commercial vehicles were sold in June, representing a 10.3% m/m increase, but a 9.7% y/y contraction. Of the 599 commercial vehicles sold in June 519 were classified as light commercial vehicles, 31 as medium commercial vehicles and 49 as heavy or extra heavy commercial vehicles. On a twelve-month cumulative basis, light commercial vehicle sales dropped 10.5% y/y, while medium commercial vehicle sales rose 5.0% y/y, and heavy commercial vehicle sales rose by 25.4% y/y. While medium- and heavy commercial vehicles continue to record growth on a twelve-month cumulative basis, the light segment of the market continues to see lower volumes sold than in 2018.

Volkswagen narrowly leads the passenger vehicle sales segment with 31.5% of the segment sales year-to-date. Toyota retained second place with 31.2% of the market share as at the end of June. Kia, Hyundai, Mercedes and Ford each command around 5.0% of the market in the passenger vehicles segment, leaving the remaining 18.2% of the market to other brands.

Toyota, with a strong market share of 59.5% year-to-date commands the light commercial vehicles sales segment. Nissan remains in second position in the segment with 11.1% of the market, while Ford makes up third place with 8.4% of the year-to-date sales. Hino leads the medium commercial vehicle segment with 36.9% of sales year-to-date, while Scania was number one in the heavy- and extra-heavy commercial vehicle segment with 37.9% of the market share year-to-date.

The Bottom Line

Vehicle sales remain under pressure, with the year-to-date new vehicle sales in 2019 currently below 2011 levels, and the total new vehicle sales for the last 12 months down 5.7% from the same period in 2018. The prospects for new vehicle sales remain dim in the short- to medium-term as government remains committed to fiscal consolidation and the economy remains in a recession, putting pressure on demand and investment.