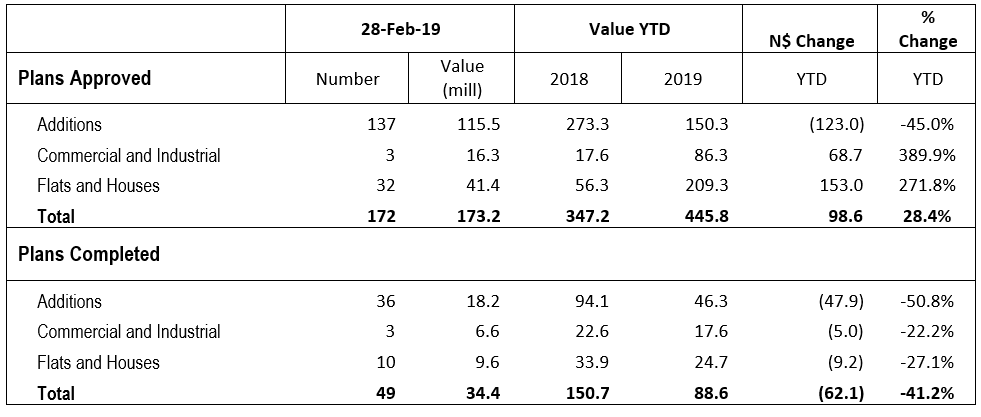
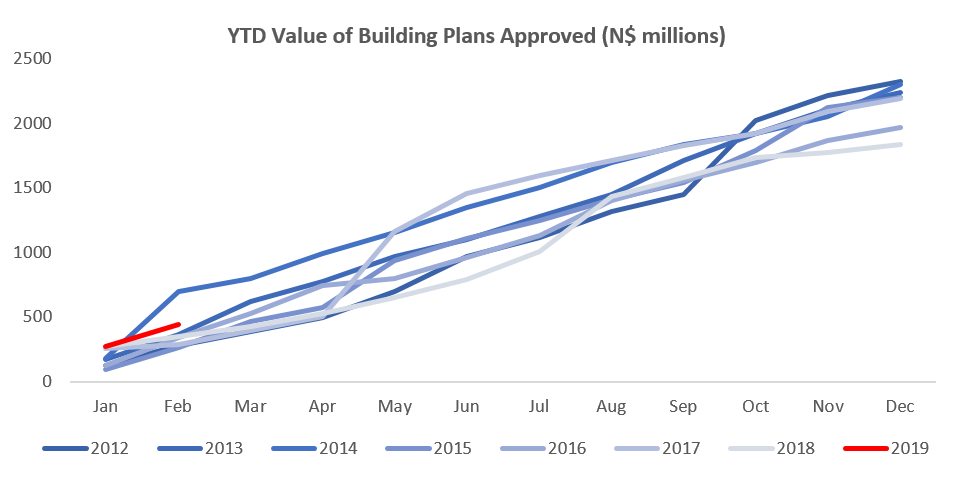
A total of 172 building plans were approved by the City of Windhoek in February. This is a slight increase in the number of plans approved on a monthly basis when compared to the 162 building plans approved in January. In monetary terms, the approvals were valued at N$173.2 million, a decrease of N$99.5 million compared to last month. 49 Buildings with a value of N$34.36 million were completed during February. The year-to-date value of approved building plans currently stands at N$445.8 million, 28.4% higher than the corresponding period in 2018. On a twelve-month cumulative basis, 2,165 building plans worth approximately N$1.94 billion were approved, an increase in number of 9.4% y/y, but a decrease of 13.8% in value terms over the prior 12-month period.
The largest portion of building plan approvals was once again made up of additions to properties, from both a number and value perspective. 137 additions were approved in February, almost matching the number of additions approved in January. Year-to-date 268 additions to properties have been approved with a cumulative value of N$150.3 million, a decline of 45.0% y/y in terms of value compared to the same period in 2018.
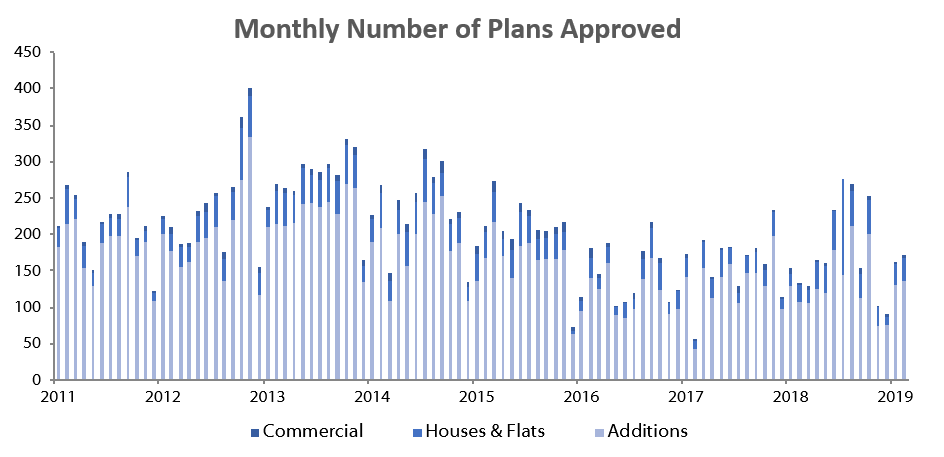
New residential units were the second largest contributor to the number of building plans approved with 32 approvals registered in February, 3 more than in January. 61 new residential units worth N$209.3 have been approved year-to-date, an increase of 271.8% when compared to the value of approvals in the corresponding period last year. This increase is, however, off of a low base figure in 2018.
3 Commercial and industrial building plans were approved in February, worth N$16.3 million. This is one more than in the prior month, bringing the total number of commercial approvals for 2019 to 5. In value terms, commercial building plan approvals decreased by 76.8% m/m, but increased 186.5% y/y. On a 12 month-cumulative basis, the number of commercial and industrial approvals has decreased by 23.5% y/y in February to 39 units, worth approximately N$449.0 million, a decrease of 33.3% in value terms over the prior 12-month period.
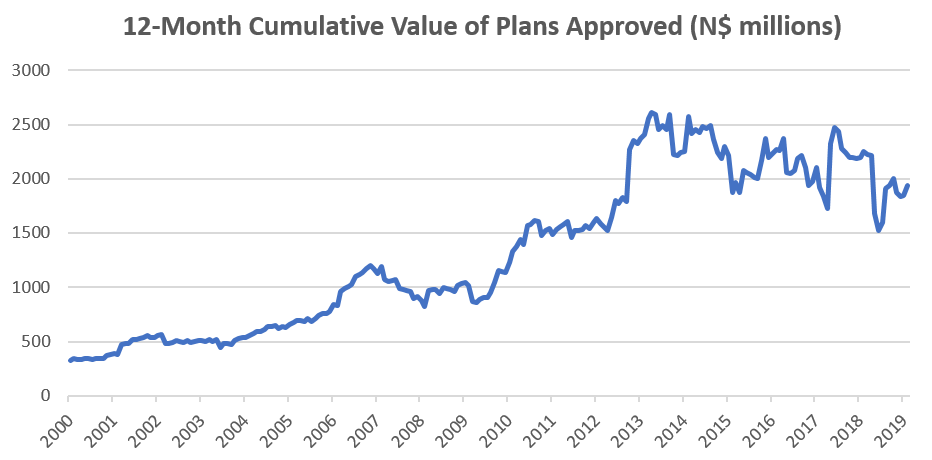
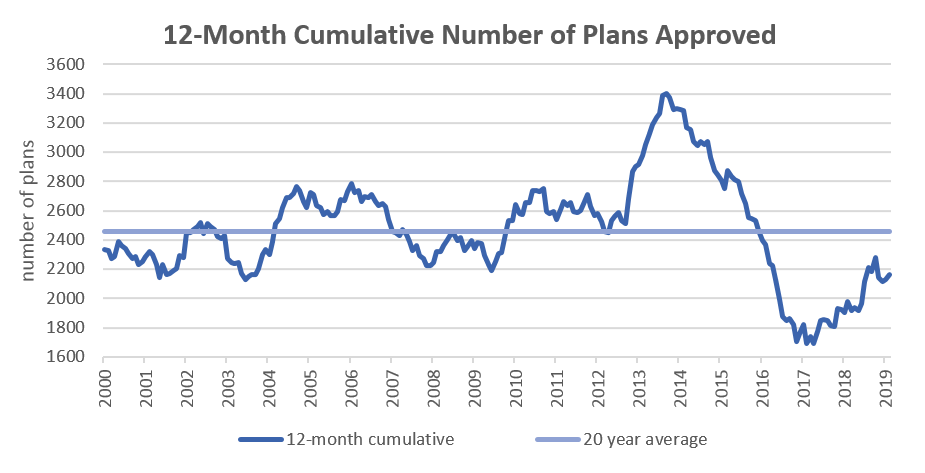
During the last 12 months 2,165 building plans have been approved, increasing by 9.4% compared to February 2018. These approvals amounted to N$1.94 billion, which is a decrease in value of 13.8% y/y. The overall decrease in value of cumulative plans approved is concerning, as this shows a considerable decrease of construction activity in the city, especially when taking into account that the measure is in nominal value terms and does not account for inflation.
Growth in commercial and industrial construction activity remains extremely subdued as the decrease (on a 12-month cumulative basis) in credit extended to corporates also reflects. It is evident from the commercial figures that business confidence is low, as businesses are not investing in expansionary projects and, as a result, the economy is likely to remain under pressure over the short-term.