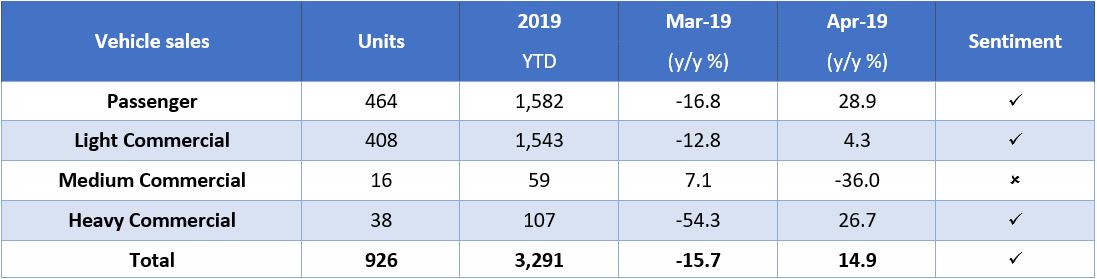
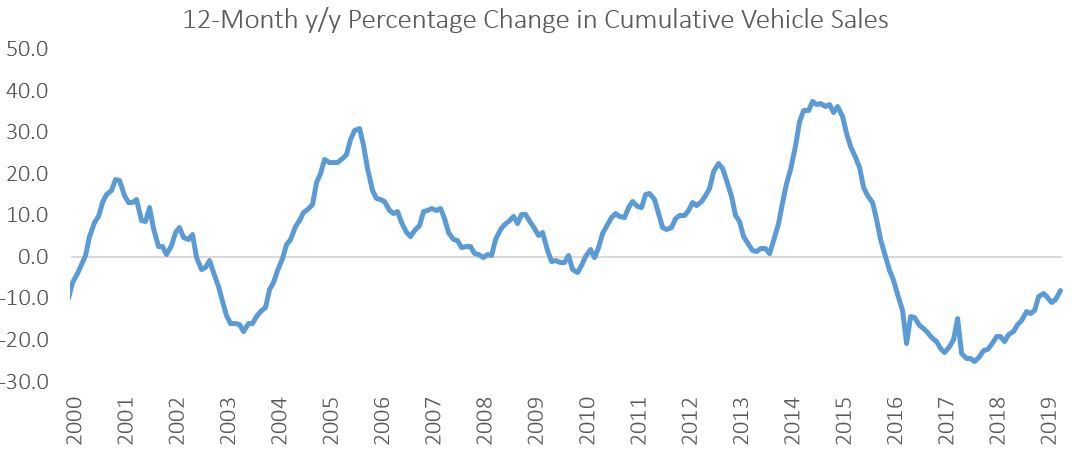
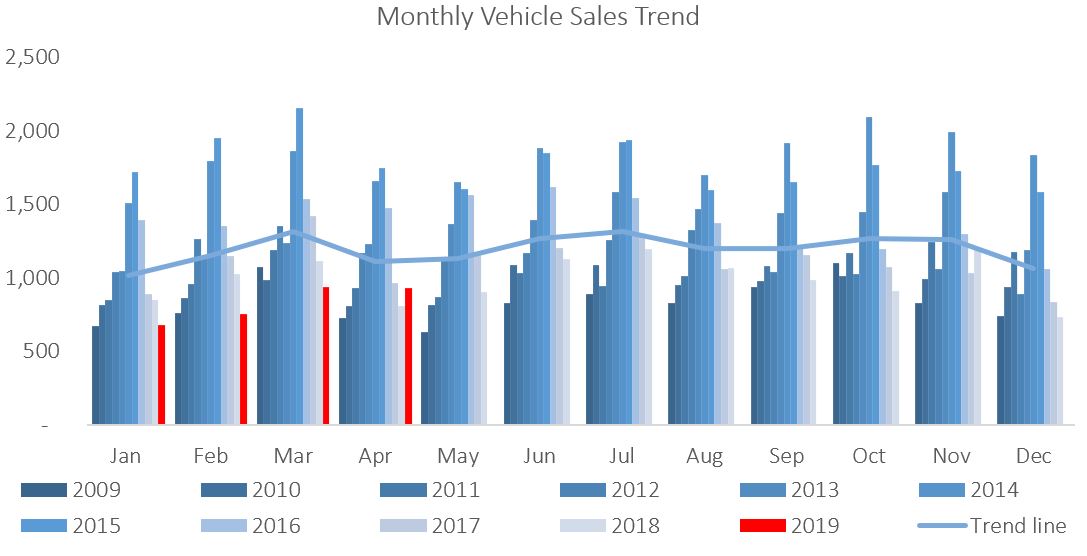
A total of 926 new vehicles were sold in April, a 1.1% m/m contraction from the 936 vehicles sold in March. Year-to-date, 3,291 vehicles have been sold of which 1,582 were passenger vehicles, 1,543 light commercial vehicles, and 166 medium and heavy commercial vehicles. On a twelve-month cumulative basis, new vehicle sales increased by 1.1% m/m to 11,405 new vehicles sold as at the end of April 2019. On an annual basis, twelve-month cumulative new vehicle sales continued on a downward trend, contracting by 8.2% from the 12,423 new vehicles sold over the comparable period a year ago.
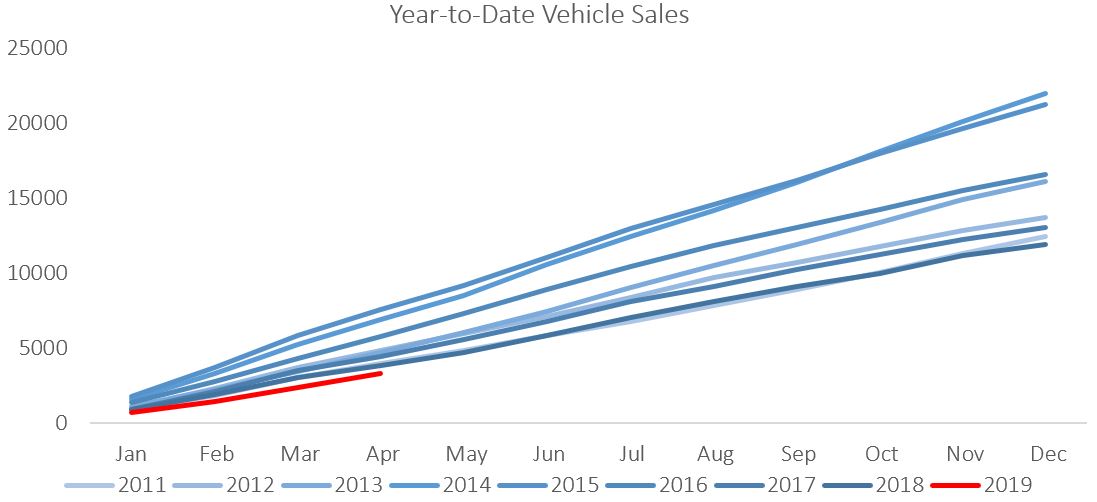
New passenger vehicle sales increased by 10.0% m/m in April, to 464 units. On an annual basis an increase of 29.9% was recorded as April saw an increase in monthly passenger vehicle sales from March for the first time since 1998. Year-to-date, passenger vehicle sales rose to 1,582 units, reflecting lower cumulative sales than the preceding 8 years, and a 10.8% decline from the year-to-date figure recorded in April 2018. Twelve-month cumulative passenger vehicle sales rose 2.2% m/m, but continued to slide on an annual basis, contracting 6.9% y/y.
A total of 462 new commercial vehicles were sold in April, contractions of 10.1% m/m and 15.3% y/y. Of the 462 commercial vehicles sold in April, 408 were classified as light vehicles, 16 as medium vehicles and 38 as heavy vehicles. On a year-on-year basis for the month of April light commercial sales rose by 4.3%, medium commercial sales fell by 36.0%, and heavy and extra heavy sales grew by 26.7%. On a twelve-month cumulative basis, light commercial vehicle sales dropped 9.9% y/y, while medium commercial vehicle sales rose 2.2% y/y, and heavy commercial vehicle sales fell 4.3% y/y. While medium commercial vehicles have recorded growth in twelve-month cumulative sales over the last seven months, the light and heavy segments of the market continue to see lower volumes sold than in 2018, already a low base. This is an indication that businesses are yet to increase capital deployment in any meaningful way as business confidence remains under pressure.
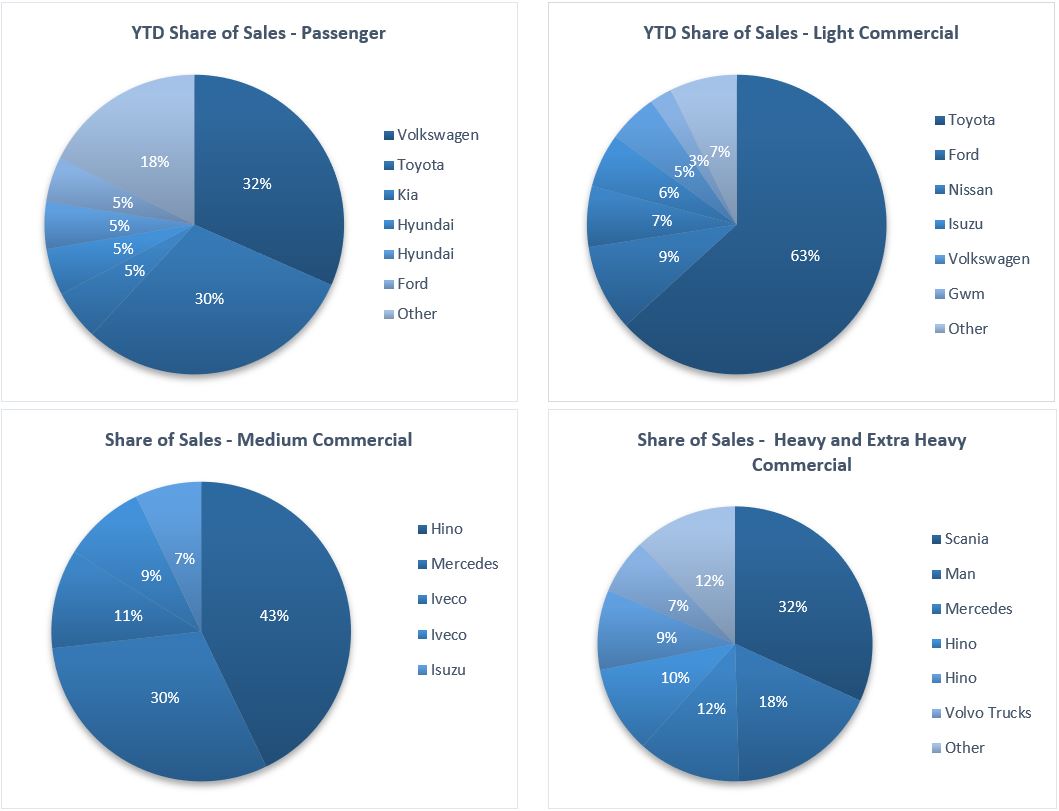
Volkswagen once again leads the passenger vehicle sales segment with 31.6% of the segment sales year-to-date. Toyota dropped to second place by this measure with 30.3% of the market-share as at the end of April. Kia, Hyundai, Mercedes and Ford each command around 5.0% of the market in the passenger vehicles segment, leaving the remaining 17.7% of the market to other brands.
Toyota, with a strong market-share of 63.3% ytd, commands the light commercial vehicles sales segment. Ford remains in second position in the segment with 9.3% of the market, while Nissan makes up third place with 6.5% of the year-to-date sales. Hino leads the medium commercial vehicle segment with 40.7% ytd of sales, while Scania was number one in the heavy and extra-heavy commercial vehicle segment with 31.8% of the market share year-to-date.
The Bottom Line
Vehicle sales continue to point to low consumer and business confidence. Anecdotal evidence, as well as Bidvest Namibia automotive division results over the last two years, show struggling dealerships. After eleven quarters of largely stagnant economic activity in Namibia it is hardly surprising that confidence remains low. At present there are few signs that the business cycle is turning, with a global slowdown providing headwinds to an outlook already weighed down by drought. At present there are few prospects for stimulus as government continues to run large budget deficits, with debt largely funding consumption. One of the few levers we believe is available to government at present is policy clarity and growth friendly policy. Clarity on empowerment and investment policy is crucial in 2019, as well as SOE reform.