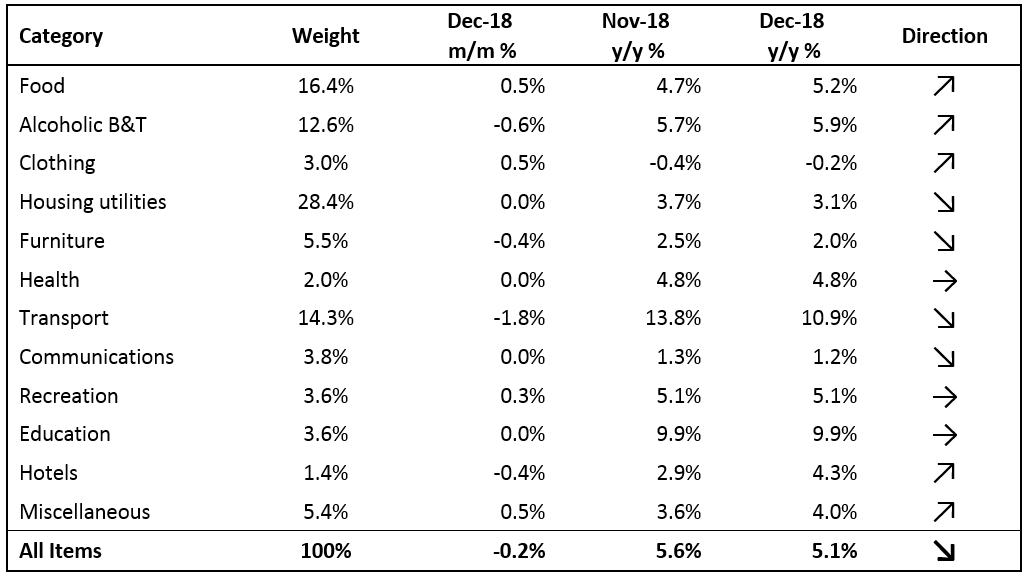
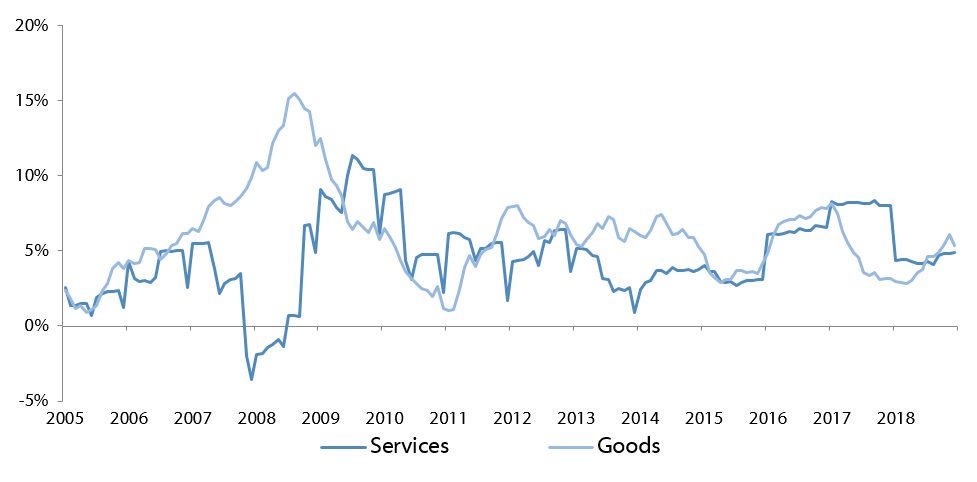
The Namibian annual inflation rate moderated to 5.1% y/y in December, following the 5.6% y/y increase in prices recorded in November. Prices in the overall NCPI basket decreased 0.2% m/m. The annual average inflation rate for 2018 was 4.3%, compared to 6.2% in 2017. On a year-on-year basis, overall prices in five of the twelve basket categories rose at a quicker rate in December than in November, with four categories recording slower rates of inflation and three categories remained unchanged. Prices for goods increased by 5.3% y/y while prices for services increased by 4.9% y/y.
Transport, the third largest basket item, was the largest contributor to annual inflation, accounting for 1.5% of the total 5.1% annual inflation rate. Prices for this basket item decreased by 1.8% m/m, but increased 10.9% y/y in December. Prices in all three sub-categories recorded increases on a year-on-year basis. Prices relating to the purchase of vehicles increased at a rate of 6.8% y/y, while prices related to public transportation services increased by 18.2% y/y due to the increases in taxi and bus fares in September.
The operation of personal transport equipment saw a price decrease of 2.8% m/m but an increase of 10.5% y/y. The month-on-month price decrease for this subcategory is a result of the cut in fuel pump prices announced by the Ministry of Mines and Energy at the beginning of December. The minister cut the price of unleaded and diesel by 100 cents per litre and 40 cents per litre, respectively, due to a decrease in the global oil price.
The price of Brent Crude oil increased by more than 20% in the first half of 2018, and hit a four-year high of US$86.29 per barrel in October. The price of oil has since fallen about 30% due to rising inventories and rapidly rising shale oil production in the US. Although the oil price has recovered somewhat from the beginning of the year, it continues to be weighted down by weaker economic growth forecasts in China.
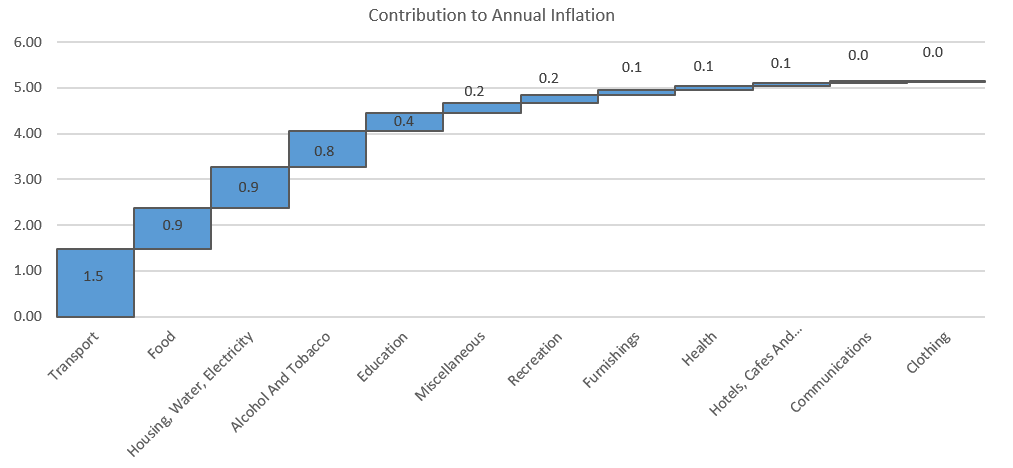
Food and non-alcoholic beverages accounted for 0.9% of the total annual inflation rate. Food inflation is currently running at 5.2% y/y, up from the 4.7% y/y figure seen in November. The sub-categories of food and non-alcoholic beverages showed relatively low monthly increases, while six of the sub-categories showed monthly decreases. Prices of mineral waters, soft drinks and juices decreased by 1.8% m/m, while the prices of other non-alcoholic beverages declined 1.0% m/m in December. On an annual basis, prices of vegetables and fruits increased 12.8% y/y and 8.1% y/y respectively. Bread and cereal prices rose 7.9% y/y. The slow increase in meat, fish, and soft drink and mineral water prices helped keep food inflation tethered within low- to mid-single-digit levels for the year.
The Housing and utilities category was the third largest contributor to annual inflation due to its large weighting in the basket. Prices for this category remained flat m/m and increased 3.1% y/y. Prices in the electricity, gas and other fuels subcategory increased 4.9% y/y, significantly slower than the inflation of 8.7% recorded in November, due to base effects. The regular maintenance and repair of dwellings subcategory registered an increase in prices of 2.5% y/y although prices decreased by 0.7% m/m. This follows a 0.3% decrease in prices in this category in November.
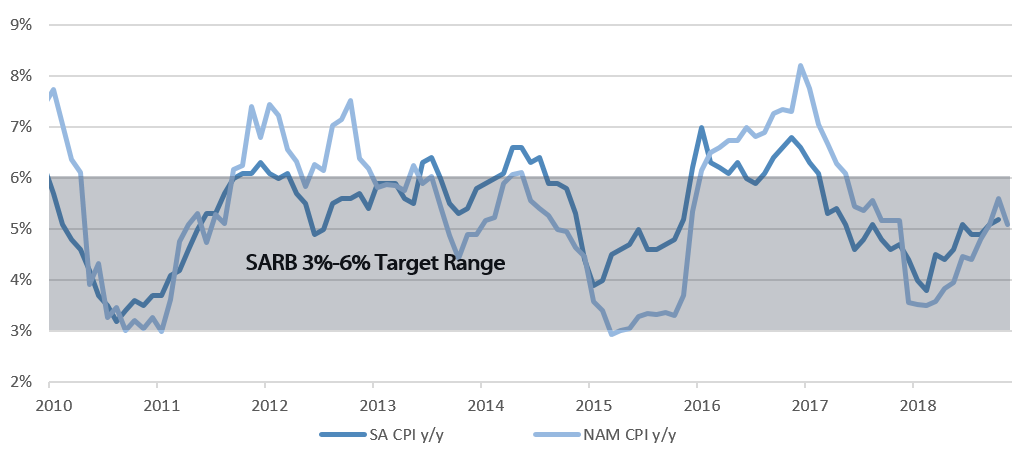
The moderation in the Namibian annual inflation rate to 5.1% was somewhat expected given the cut in fuel pump prices in December. We expect transport inflation to continue its slower growth rate on an annual basis in the short-term due to the further fuel pump price cut in January, relatively low oil prices, and the stronger exchange rate. The above-mentioned factors hold true for South African inflation too and as such filter into the SARB’s Monetary Policy Committee forecasts and decisions. Relief from lower oil and fuel prices should lead to a slightly more dovish SARB, all else equal, which is likely to lead to interest rates being left unchanged later this week when the SARB MPC meets.
Local food prices might increase going forward if imports of cloven-hoofed animals and their products remain banned for some time due to the outbreak of foot-and-mouth disease in the Limpopo province in South Africa.