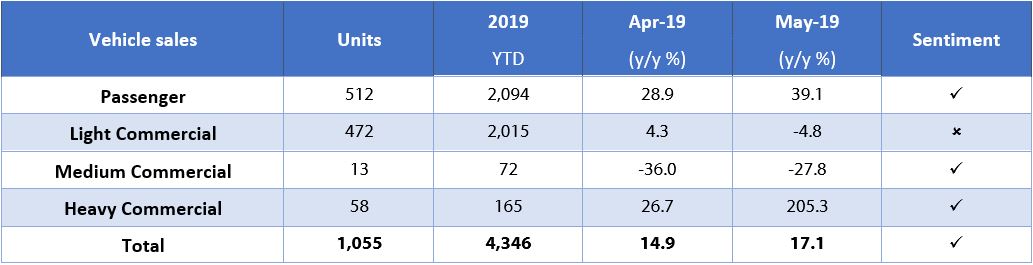
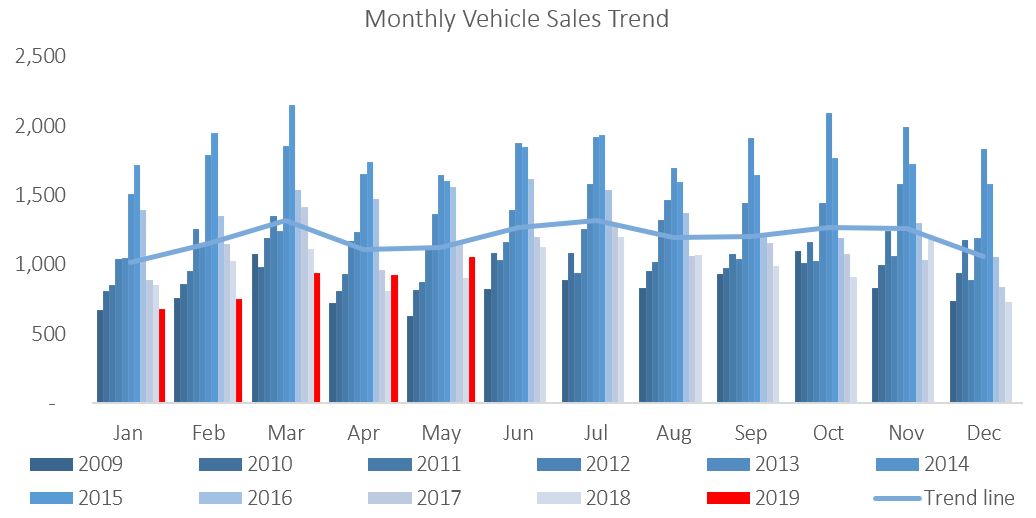
A total of 1,055 new vehicles were sold in May, a 13.9% m/m increase from the 926 vehicles sold in April. Year-to-date, 4,346 vehicles have been sold of which 2,094 were passenger vehicles, 2,015 were light commercial vehicles, and 237 were medium and heavy commercial vehicles. On a twelve-month cumulative basis, new vehicle sales increased by 1.4% m/m to 11,559 new vehicles sold as at the end of May 2019. On an annual basis, twelve-month cumulative new vehicle sales continued on a downward trend, contracting by 5.0% from the 12,172 new vehicles sold over the comparable period a year ago.
512 New passenger vehicle sales were sold in May, an increased by 10.3% m/m and 39.1% y/y. Year-to-date, passenger vehicle sales rose to 2,094 units, reflecting lower cumulative sales than the preceding 8 years, and a 2.2% decline from the year-to-date figure recorded in May 2018. Twelve-month cumulative passenger vehicle sales rose 2.9% m/m, but continued to slide on an annual basis, contracting by 1.8% y/y.
A total of 543 new commercial vehicles were sold in May, 17.5% more than in April and 1.9% more than in May 2018. Of the 543 commercial vehicles sold in May, 472 were classified as light commercial vehicles, 13 as medium commercial vehicles and 58 as heavy or extra heavy commercial vehicles. On a twelve-month cumulative basis, light commercial vehicle sales dropped 8.9% y/y, while medium commercial vehicle sales rose 2.3% y/y, and heavy commercial vehicle sales rose by 9.0% y/y. Medium and heavy commercial vehicle sales seem to have quelled the downward trend on a twelve-month cumulative basis. Medium commercial vehicle sales have registered modest growth by this measure for 8 consecutive months now, while heavy commercial vehicle sales have posted growth for the first time since early 2016.
Volkswagen leads the passenger vehicle sales segment with 33.4% of the segment sales thus far in 2019. Toyota retained second place with 30.2% of the market-share as at the end of May. Kia, Hyundai, Mercedes round out the top selling brands in the segment with 5.2%, 4.8% and 4.7% market share year-to-date. This leaves the remaining 21.7% of the market to other brands.
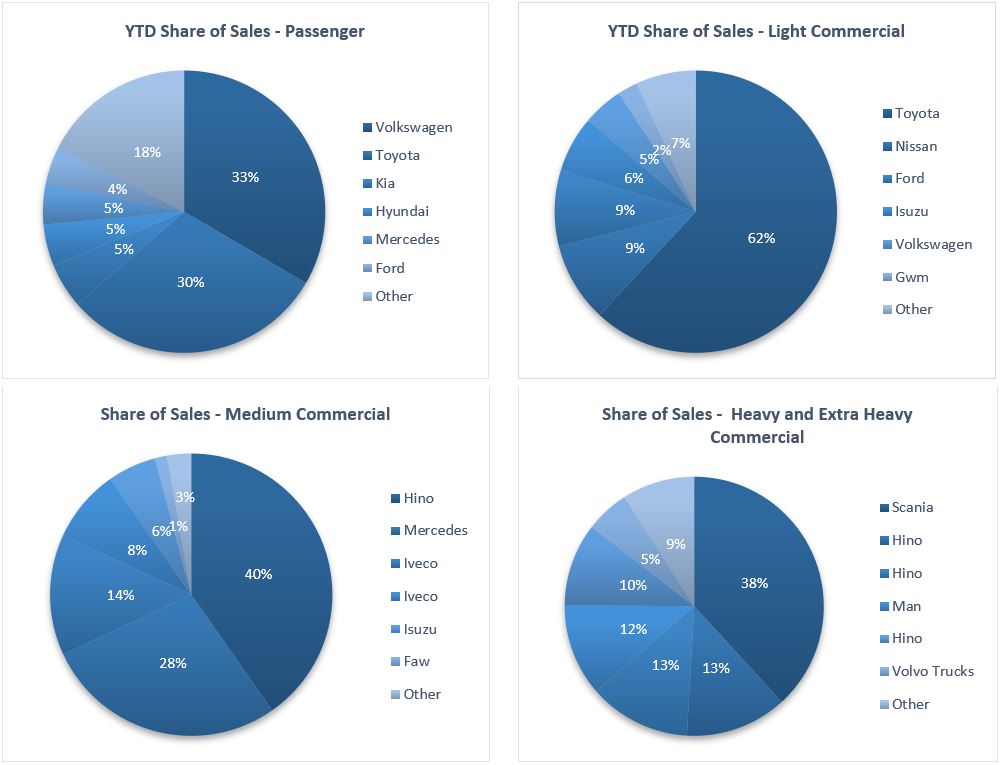
Toyota remained the best-selling brand in the light commercial vehicle sales segment with 61.9% of the market share year-to-date. Ford drops to third place in the segment with 8.7% of the market share after being displaced by Nissan with 9.1% of the year-to-date sales. Hino leads the medium commercial vehicle segment with 40.3% of sales year-to-date, while Scania was number one in the heavy and extra-heavy commercial vehicle segment with 38.2 of the market share year-to-date.
The Bottom Line
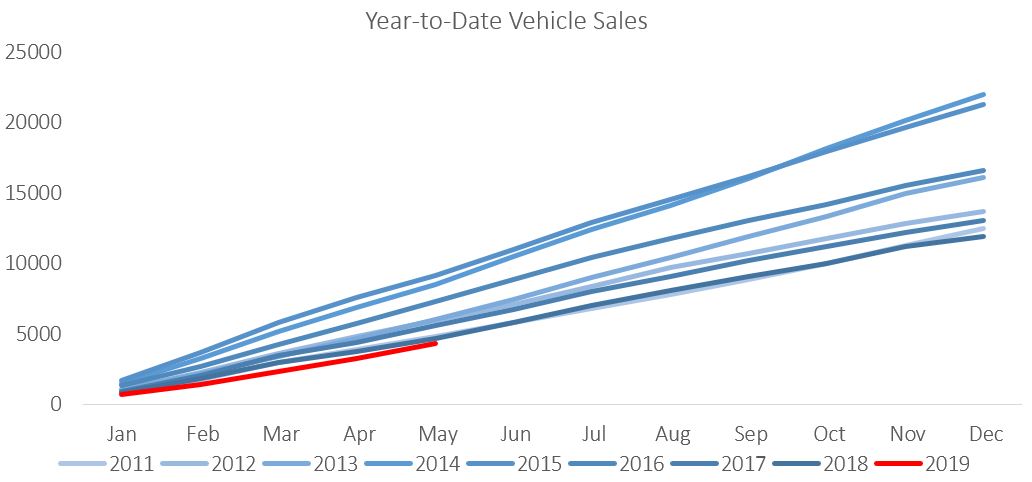
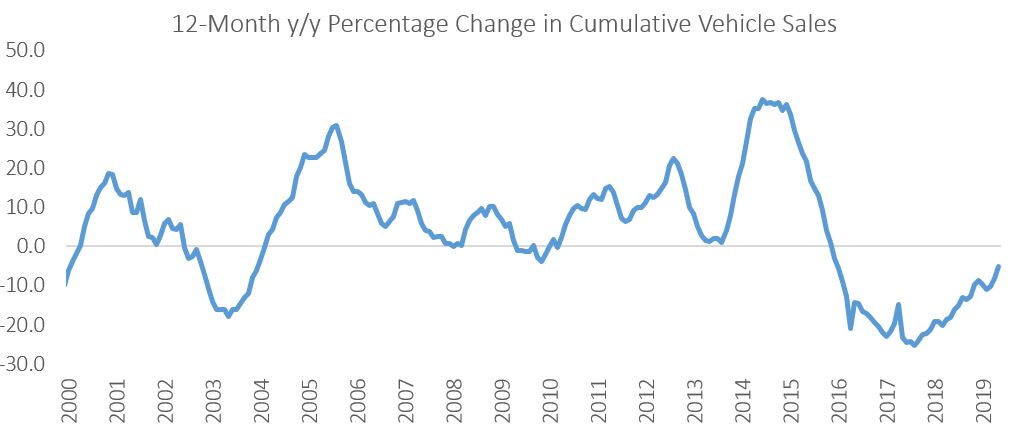
Vehicle sales remain under pressure as is evident in the figures below. Year-to-date new vehicle sales in 2019 are currently below 2011 levels, reflective of depressed business and consumer confidence. Total new vehicle sales for the last 12 months is 49% down from peak levels seen in 2015. Vehicle sales is a lagging economic indicator and thus tells us little about what to expect going forward, but illustrates the extent of the downturn we have been through thus far.