New Vehicle Sales – August 2018

A total of 1,061 new vehicles were sold in August, representing an 11.0% m/m decrease from the 1,192 vehicles sold in July, but 1.7% more than in August 2017. Year-to-date 8,070 vehicles have been sold of which 3,629 were passenger vehicles, 4,023 light commercial vehicles, and 418 medium and heavy commercial vehicles. On a rolling 12-month basis, a total of 12,031 new vehicles were sold as at 31 August 2018, representing a contraction of 13.1% from the 13,848 sold over the comparable period a year ago.

A total of 421 new passenger vehicles were sold during August, decreasing by a hefty 30.4% m/m. From a year-on-year perspective however, 39 more units were sold in August 2018 (up 10.2%) than a year ago. Year-to-date passenger vehicle sales rose to 3,629 units, reflecting a 7.3% decline from August 2017.

640 New commercial vehicles were sold in August, representing a 9.0% m/m increase, but a 3.2% y/y contraction. 552 light commercial vehicles, 17 medium commercial vehicles, and 71 heavy commercial vehicles were sold during the month. On a year-on-year basis, light commercial vehicle sales have dropped by 10.2%, medium commercial sales increased 41.7% and heavy and extra heavy sales rose by 108.8%. On a twelve-month cumulative basis, commercial vehicle sales remain depressed with light commercial vehicle sales decreasing by 16.9% y/y, medium commercial vehicle sales declining by 0.8% y/y and heavy commercial vehicle sales dropping by 4.8% y/y.

Toyota continues to lead the market for new passenger vehicles sales in 2018 based on the number of new vehicles sold, claiming 35.5% of the market, followed by Volkswagen with a 28.0% share. They were followed by Hyundai and Kia at 5.5% and 4.7% respectively.

Toyota also remained the leader in the light commercial vehicle space with 57.5% market share, with Nissan in second place with a 16.5% share. Ford and Isuzu claimed 9.0% and 5.3% respectively of the number of new light commercial vehicles sold for the year. Hino leads the medium commercial vehicle category with 42.7% of sales while Scania remains number one in the heavy and extra-heavy commercial vehicle segment with 36.6% of the market share year-to-date.

The Bottom Line

The outlook for new vehicle sales remains bleak with the cumulative number of new vehicle sales as at the end of August amounting to 12,031, a decline of 47.0% from the peak of 22,664 new vehicle sales recorded in April 2015. Year-on-year, the cumulative number of new vehicles sold has contracted by 13.1% from the 13,848 cumulative sales recorded in August 2017. Factors such as fiscal consolidation, low consumer and business confidence, expected fuel price increases, coupled with an increasing likelihood of interest hikes over the next 24 months, mean that no significant recovery in vehicle sales can be expected over the short to medium-term.

NCPI – August 2018

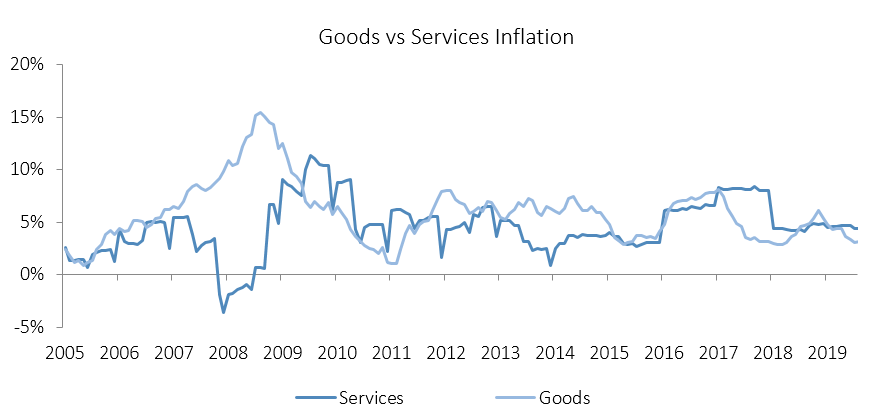
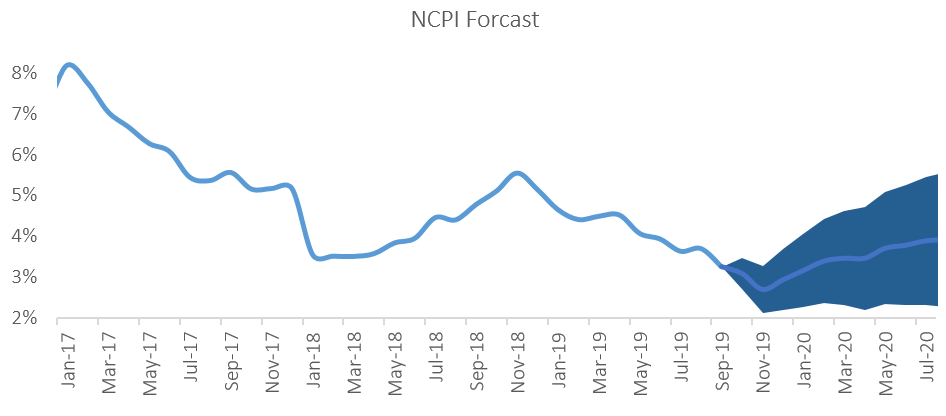
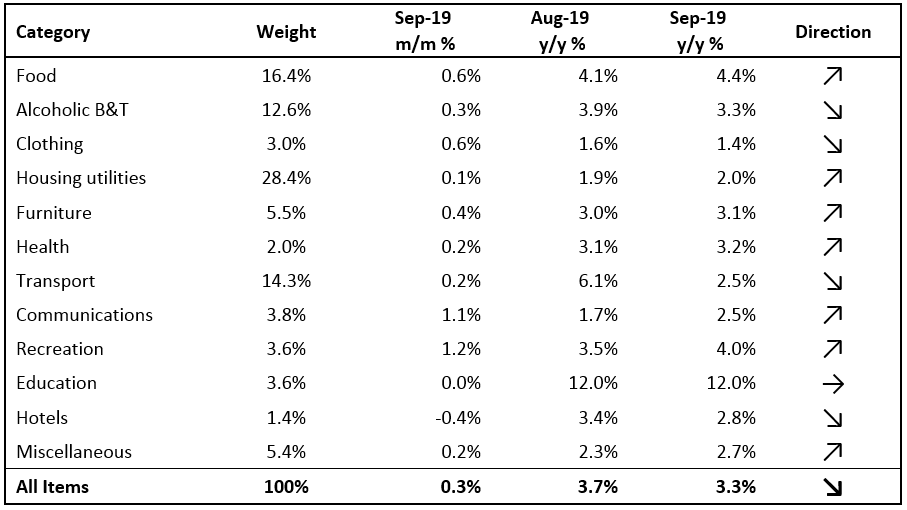
The Namibian annual inflation rate decreased to 4.4% in August, a slightly slower pace than the 4.5% y/y rate of increase in prices recorded in July. The overall NCPI basket registered no price increases on a month-on-month basis in August, following inflation of 0.5% m/m in July. On an annual basis prices in just two of the twelve basket categories rose at a quicker rate in August than in July. Slower rates of inflation in six categories largely contributed to the overall slower rate of increases recorded in August. The rate of inflation in three of the twelve categories remained unchanged. Prices for goods increased at a rate of 4.6% y/y in August, consistent with the July rate. Prices for services increased at a rate of 4.1% y/y following a 4.3% y/y increase in July.

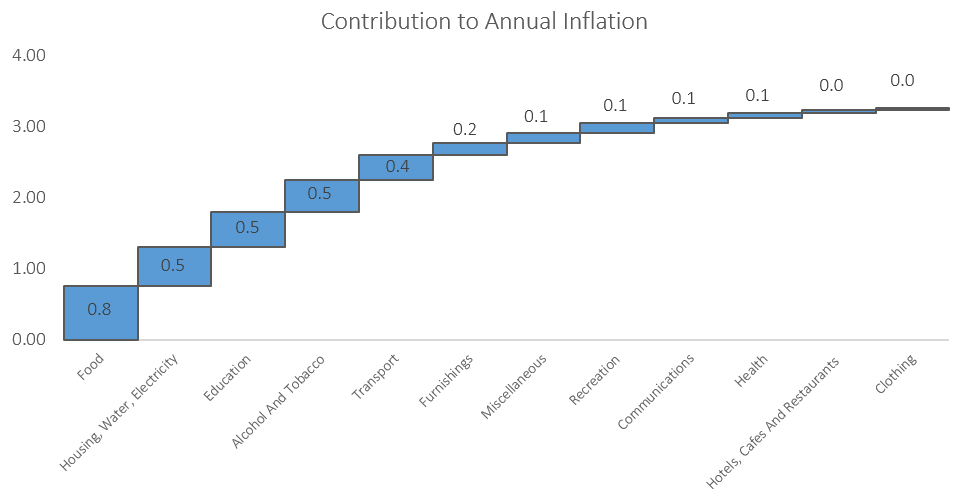
Just as it was in July, transport was the largest contributor to annual inflation in August, accounting for 1.3% of the total 4.4% annual inflation rate. On a monthly basis, transport prices increased at a rate of 0.8% in August, rising faster than the 0.6% m/m increase recorded in July. On an annual basis, transport prices increased by 9.7%, faster than the 8.9% y/y increase recorded in July. August has also been the third consecutive month in which transport prices have been increasing at a quicker annual pace. Prices in the three subcategories all recorded increases on a year-on-year basis. Prices relating to the purchase of vehicles increased at a rate of 7.9% y/y, while prices relating to the operation of personal transport equipment increased by 12.6% y/y. A 20% increase in taxi fares was approved in August and so will only reflect in the public transportation services subcategory from next month. This was the only subcategory that registered a slower pace of increase in August of 1.7% compared to 1.8% in July.

The transport category has been under pressure following consecutive months of fuel price hikes, with hikes in September being the latest. The price of Brent Crude oil has rallied since the start of August, following a drop in price for much of July. Currency weakness observed in August coupled with the increase in the price of Brent Crude oil drove the increase in fuel prices. As long as these pressures and under-recoveries remain, we expect that the ministry of mines and energy will continue hiking fuel pump prices.

The Housing and utilities category was the second largest contributor to annual inflation, due to its large weighting in the basket. Prices for this category increased by a rate of 0.8% m/m and 4.4% y/y. The electricity, gas and other fuels subcategory recorded the largest increase in prices at 13.2% y/y, faster than inflation of 8.4% y/y recorded in July. Month-on-month, prices in this subcategory increased by 0.5%. The water supply, sewerage service and refuse collection subcategory prices remained unchained on a monthly basis, while the regular maintenance and repair of dwellings subcategory showed prices decreasing at a rate of 0.4% m/m.

Prices for the alcoholic beverages and tobacco category increased at a rate of 5.4% y/y, but declined 0.3% m/m. Prices of alcoholic beverages increased at a rate of 5.8% y/y while tobacco prices increased at a rate of 3.8% y/y.

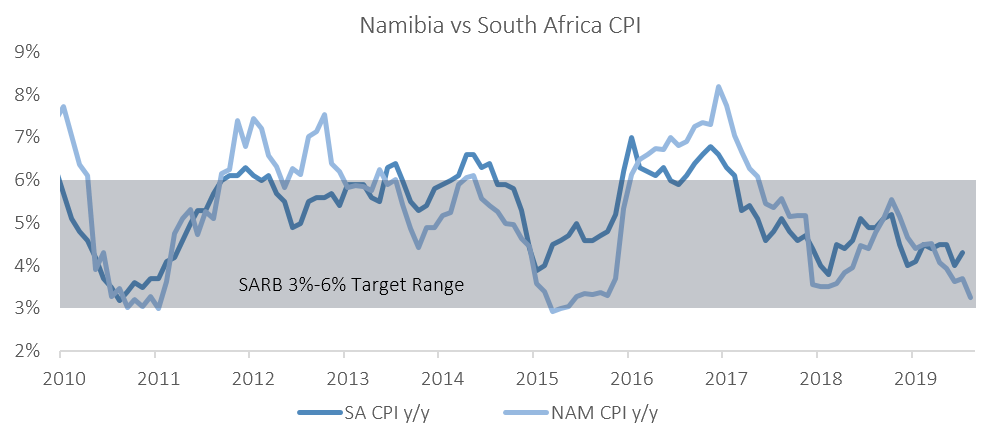
The Namibian annual inflation rate of 4.4% remains quite low seven months into 2018. It is also trending lower than that of neighbouring South Africa (July: 5.1% y/y). The factors putting upward pressure on inflation at present are currency weakness and the volatility in the price of Brent Crude oil. Tropical storms in the US (Hurricane Florence) is pilling doubt on US production, with expectations for limited supply, which is driving the oil price upward. Fears of Turkish and Argentinian troubles spreading further afield have resulted in prolonged emerging market bond and equity sell-offs. The EM risk-off sentiment has seen the rand weakening by over 17% from the start of August to a peak of R15.60/US$ during the first week in September. Effects of a weaker rand are passed through to Namibia by way of the currency peg. The uncertainty of how long this currency weakness will persist directly feeds into the SARB’s inflation forecast at a time when SA inflation is trending towards the SARB’s 6% upper boundary for annual inflation. If the SARB believes that inflation could break through its 6% target it is likely to hike interest rates in an attempt to rein in escalating inflation. Should the SARB hike rates we believe that the Bank of Namibia is likely to follow suit in order to maintain the reserve position. Higher interest rates will be a further drag on the already struggling Namibian economy.

Building Plans – August 2018

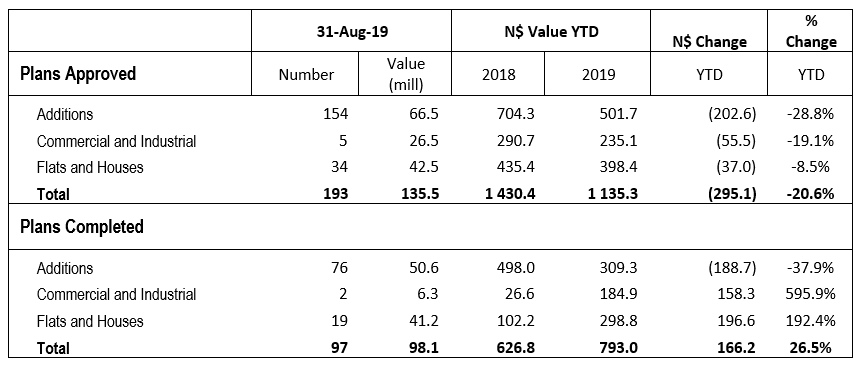
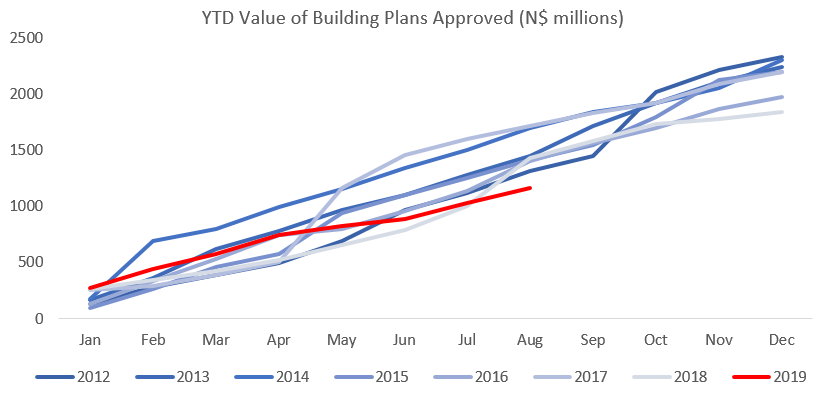
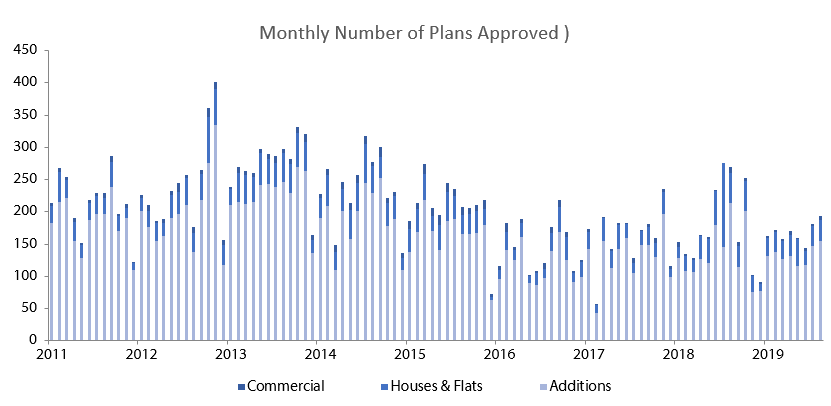
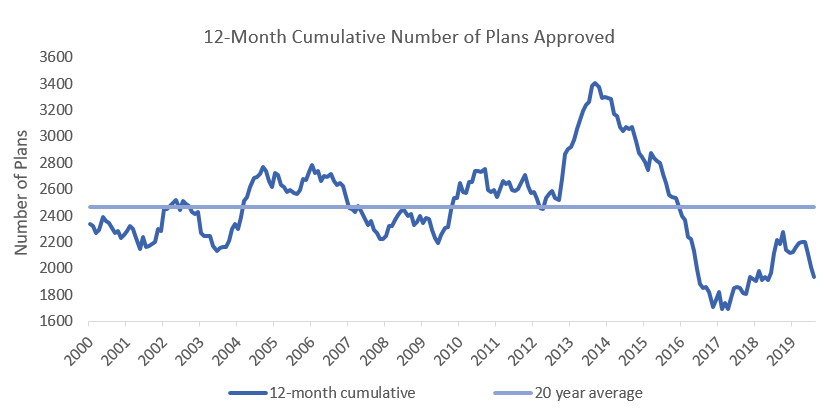
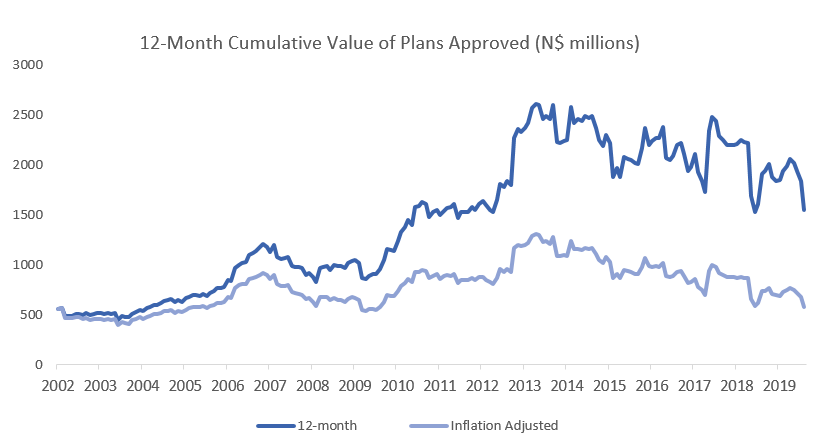
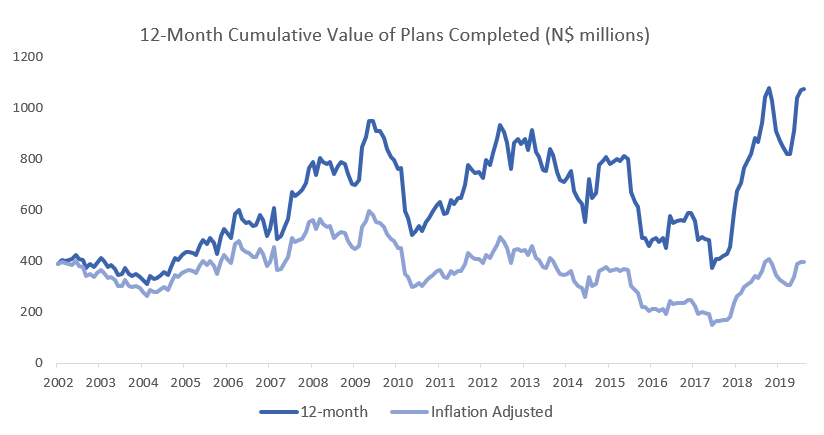
A total of 269 building plans were approved by the City of Windhoek in August, decreasing by 2.5% m/m but increasing by 56.4% y/y. In value terms, however, approvals increased by N$208.8 million to N$423.5 million, a 264.4% m/m and 97.3% y/y increase. A total of 269 completions to the value of N$94.9 million were recorded in August, a 3.5% y/y increase in number and 21.7% up y/y in value. The year-to-date value of approved building plans reached N$1.43 billion, 16.5% lower than the comparative period a year ago. On a twelve-month cumulative basis, 2,212 building plans were approved worth approximately N$1.91 billion, 16.4% lower in value terms than approvals as at the end of August 2017.

The majority of the number of building plan approvals were made up of additions to properties. For the month of August, 213 additions were approved worth N$83.2 million, 14.1% less in value terms than in July, although the number of additions approved increased by 46.9% m/m and 43.9% y/y. Year-to-date, 1,128 additions have been approved, which is 120 more than in the corresponding period last year. In value terms, $704.3 million worth of additions have been approved year-to-date, a decrease of 6.0% y/y.

New residential units were the second largest contributor to building plans approved, accounting for 47 of the total 269 approvals registered in August. Year-to-date, 364 new residential units have been approved, 168 more than during the corresponding period in 2017. In monetary terms, N$435.4 million worth of residential plans have been approved year-to-date, an expansion of 34.8% when compared to the corresponding period last year.

Commercial and industrial building plans approved amounted to 9 units, worth N$247.8 million for August. The largest single commercial building plan approval of the month amounted to N$148 million. Year-to-date, 28 plans for commercial and industrial purposes have been approved which is one more than in the corresponding period in 2017. However, the year-to-date value of commercial and industrial approvals at N$290.7 million is 54.7% lower than in the corresponding period last year. This highlights the lack of commercial and industrial development in the first half of 2018.

From a 12-month cumulative perspective, 2,212 total building plans have been approved by August, an increase of 19.5% y/y. In value terms however, approvals are down 16.4% y/y over the same period. The latest private sector credit extension data showed slowing growth in credit extended to corporates and individuals in July. Mortgage loans extended to corporates contracted by 1.9% m/m in July, but rose by 1.0% m/m for individuals. Commercial banks currently enjoy a healthy monthly average liquidity position of N$4.8 billion, providing sufficient levels of loanable funds. Banks are, however, currently weary of the construction industry as the balance sheets of many of the companies are stretched. Low consumer and business confidence, coupled with an increasing likelihood of interest rate hikes over the next 24 months, means that the credit appetite of both individuals and corporates is currently low and that no significant improvement in the approvals and completions numbers are expected in the short term.