Twitter Timeline
[custom-twitter-feeds]
Categories
- Calculators (1)
- Company Research (300)
- Capricorn Investment Group (52)
- FirstRand Namibia (54)
- Letshego Holdings Namibia (26)
- Mobile Telecommunications Limited (7)
- NamAsset (3)
- Namibia Breweries (45)
- Oryx Properties (59)
- Paratus Namibia Holdings (6)
- SBN Holdings Limited (18)
- Economic Research (663)
- BoN MPC Meetings (13)
- Budget (19)
- Building Plans (142)
- Inflation (143)
- Other (28)
- Outlook (17)
- Presentations (2)
- Private Sector Credit Extension (142)
- Tourism (7)
- Trade Statistics (4)
- Vehicle Sales (144)
- Media (25)
- Print Media (15)
- TV Interviews (9)
- Regular Research (1,820)
- Business Climate Monitor (75)
- IJG Daily (1,623)
- IJG Elephant Book (12)
- IJG Monthly (108)
- Team Commentary (250)
- Danie van Wyk (61)
- Dylan van Wyk (27)
- Eric van Zyl (16)
- Hugo van den Heever (1)
- Leon Maloney (11)
- Top of Mind (4)
- Zane Feris (12)
- Uncategorized (6)
- Valuation (4,530)
- Asset Performance (117)
- IJG All Bond Index (2,103)
- IJG Daily Valuation (1,821)
- Weekly Yield Curve (488)
Meta
Category Archives: Economic Research
NCPI – November 2019

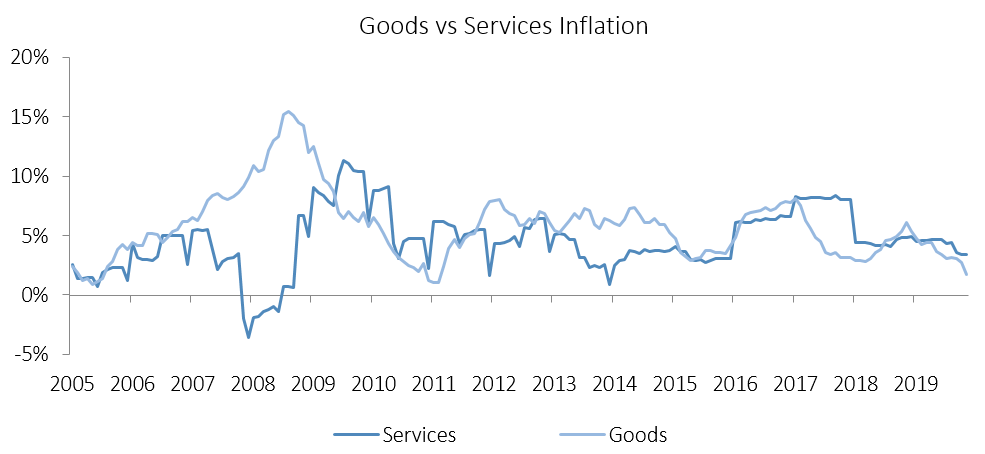
The Namibian annual inflation rate slowed for a third consecutive month, moderating to 2.5% y/y in November, hitting the lowest levels since August 2005. Prices increased by 0.1% m/m. On an annual basis prices in four of the twelve basket categories rose at a quicker rate in November than in October, two categories recorded increases consistent with the prior month, while the annual rate of price increases in six categories slowed during the month of November. Prices for goods rose by 1.7% y/y while prices for services rose 3.4% y/y.
The housing and utilities category was the largest contributor to annual inflation in November due to its large weighting in the basket, accounting for 0.53 percentage points of the total 2.5% annual inflation rate. Price inflation for this category once again came in at 1.9% y/y but remained relatively flat month-on-month. The regular maintenance and repair of dwellings subcategory recorded an increase in prices of 5.0% y/y, which is a higher rate of increase than the 2.5% y/y registered the previous month. Month-on-month, prices in this subcategory increased by 2.2%. Prices in the electricity, gas and other fuels subcategory declined by 0.8% y/y. Annual inflation for rental payments remained unchanged at 2.3% y/y in November.

Food & non-alcoholic beverages, was the second largest contributor to annual inflation, accounting for 0.51 percentage points of the 2.5% annual inflation rate. Prices in this category increased by 0.4% m/m and 2.9% y/y. Prices in eleven of the thirteen sub-categories recorded increases on an annual basis, with the largest increases being observed in the prices of fruits and vegetables, recording price increases of 14.0% y/y and 14.4% y/y respectively. Meat prices decreased by 0.3% y/y, compared to the 1.9% y/y increase recorded in the previous month. Due to the ongoing drought there has been a large-scale slaughtering of cattle. This has reduced the number of livestock in the country and going forward meat prices will likely increase as restocking of farms will cause upward pressure on prices.
The education basket category recorded inflation of 12.0% y/y, with the cost of pre-primary and primary education growing at a rate of 12.6% y/y, while secondary- and tertiary education recorded price increases of 11.0% y/y and 12.7% y/y, respectively. All three subcategories printed no price increases on a month-on-month basis.
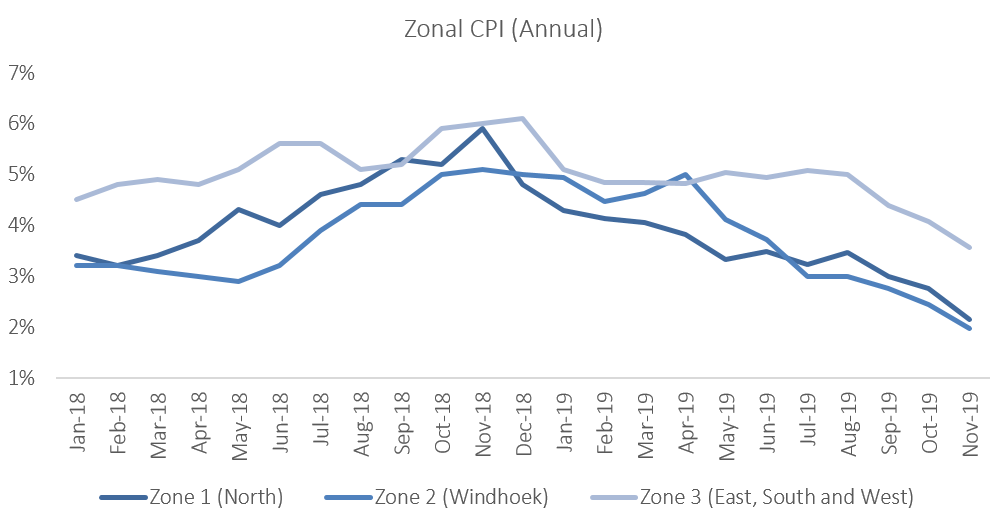
According to the zonal data, prices rose 0.5% m/m in the northern regions, but printed flat in the rest of the country on a monthly basis. On an annual basis, the Windhoek and surrounding area, recorded the lowest inflation rate at 2.0% in August, with the mixed zone 3 covering the south, east and west of the country recording the highest rate of inflation at 3.6% y/y. Inflation in the northern region of the country slowed to 2.1% y/y.

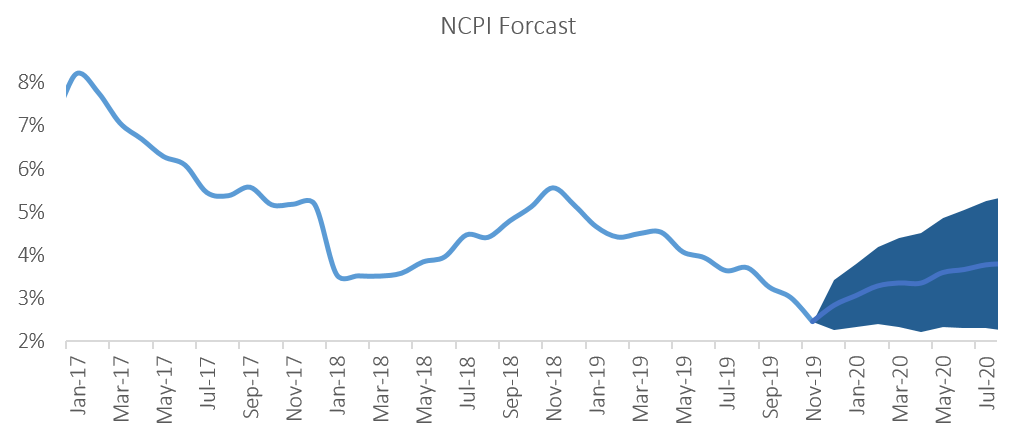
The Namibian annual inflation rate surprised further to the downside, slowing to 2.5% in November, and is trending well below South Africa’s November inflation figure of 3.6%. Inflationary pressure in Namibia remains low as gloomy domestic economic conditions translates to muted demand for both goods and services. IJG’s inflation model forecasts an average inflation rate of 3.8% y/y in 2019 and 3.5% y/y in 2020. The largest upside risk to this forecast is higher food costs as the drought affects local food production.
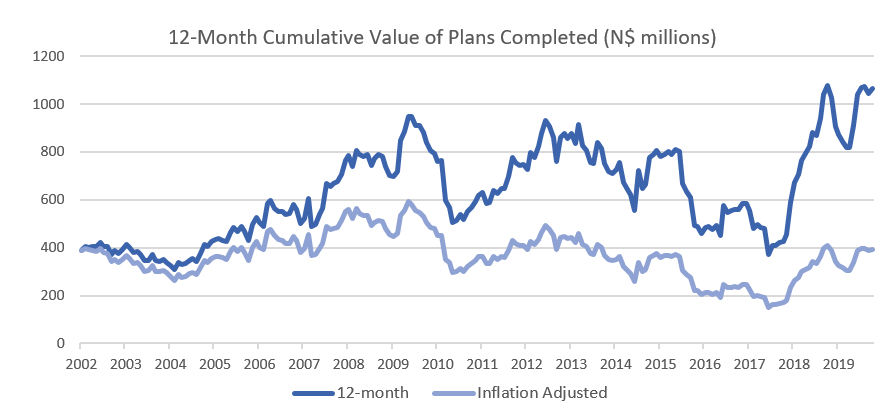
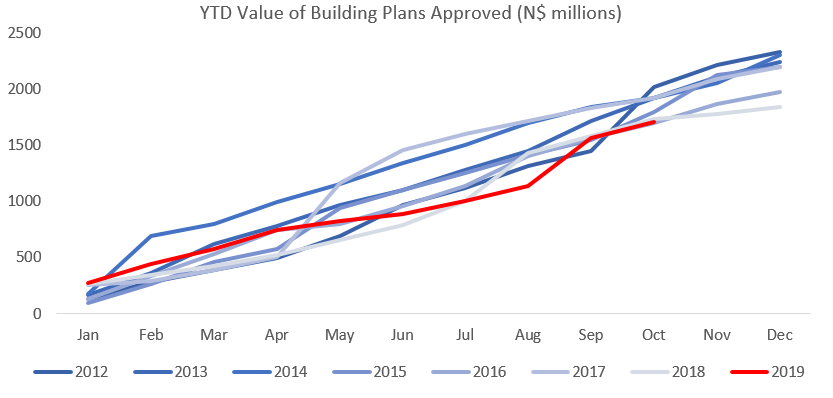
Building Plans – October 2019
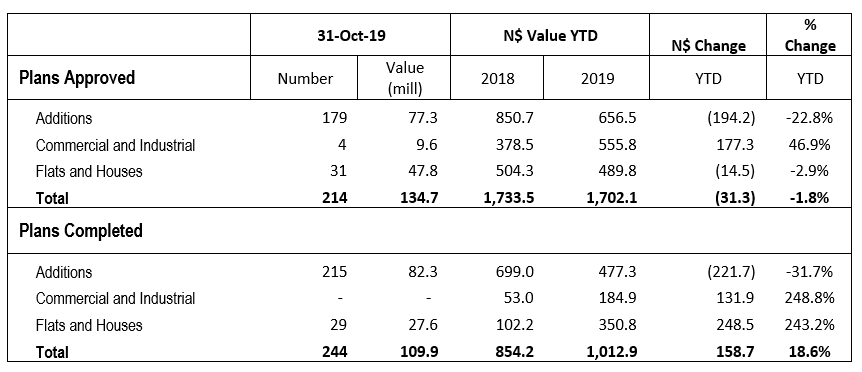
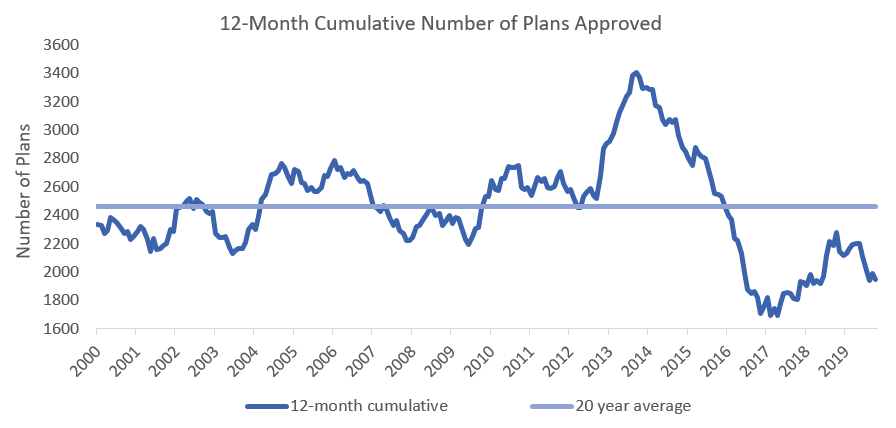
A total of 214 building plans were approved by the City of Windhoek in October. This is a 5.9% increase in the number of plans approved on a monthly basis when compared to the 202 building plans approved in September. The approvals were valued at N$134.7 million, a decrease of N$298 million or 68.8% compared to last month. The number of completions for the month of October stood at 244, valued at N$109.9 million. The year-to-date value of approved building plans currently stands at N$1.70 billion, 1.8% lower than at the end of October 2018. On a twelve-month cumulative basis 1,947 building plans worth approximately N$1.81 billion have been approved, a decrease of 14.5% y/y in number and a contraction of 9.8% in value terms over the prior 12-month period.
The largest portion of building plan approvals was once again made up of additions to properties. 179 additions to properties were approved in October, an 11.9% increase over the number of additions approved in September. Year-to-date 1,400 additions to properties have been approved with a cumulative value of N$656.5 million, a decline of 22.8% y/y in terms of value compared to the same period in 2018. Completed additions amounted to 215, valued at N$82.3 million, an increase of 4.4%% y/y in number but a contraction of 3.9% y/y in value. Year-to-date 1,028 additions have been completed to a value of N$477.3 million, a drop of 49.5% y/y in number and 31.7% y/y in value.
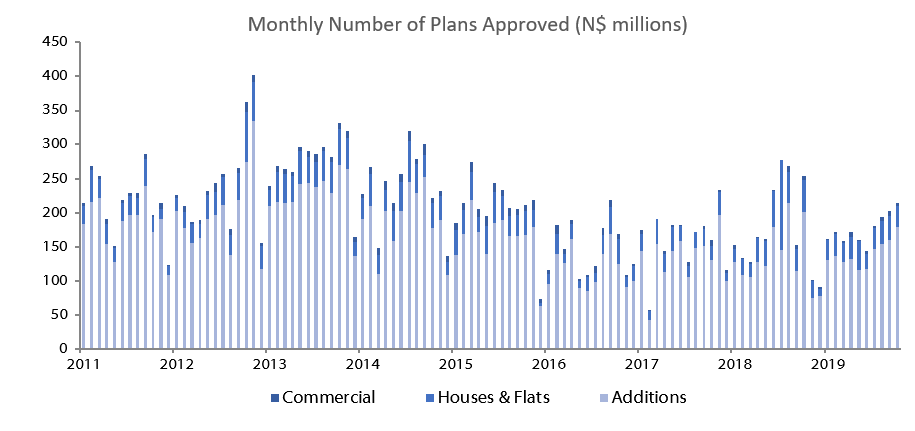
New residential units were the second largest contributor to the number of building plans approved with 31 approvals registered in October, compared to 35 in September. In value terms, N$47.8 million worth of residential units were approved in October, increases of 9.6% m/m and 8.4% y/y. 316 New residential units valued at N$489.8m were approved in the first ten months of 2019, 28.8% y/y less in number and 2.9% y/y less in value than during the corresponding period in 2018. 29 Residential units valued at N$27.6 million were completed in October bringing the year-to-date number to 254, up 323.3% y/y, and value to N$350.8 million, up 243.2% y/y.
Commercial and industrial building plans approved in October amounted to 4 units, worth N$9.6 million. The number of approvals for commercial and industrial properties has been languishing in single digit territory since September 2016 and has an average approval rate of less than 4 approvals per month over the last 12 months. On a 12-month cumulative basis, the number of commercial and industrial approvals has decreased by 10.4% y/y in October to 43 units, worth approximately N$557.7 million, an increase of 39.2% in value terms over the prior 12-month period. No commercial and industrial building plans were recorded as completed in October.
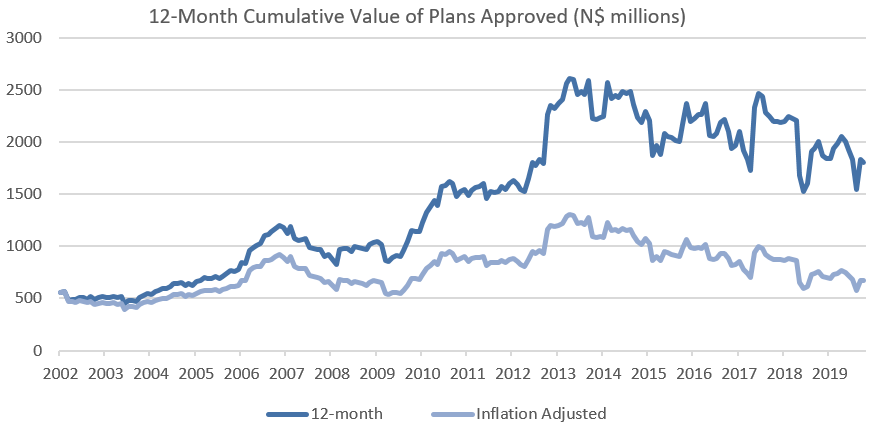
During the last 12 months, 1,947 building plans have been approved, decreasing by 14.5% y/y. These approvals were worth a combined N$1.81 billion, a decrease in value of 9.8% y/y. The number of building plans approved, on a cumulative 12-month basis, continued to contract over the last four months. The overall decrease in both number and value of cumulative plans approved is concerning as, even in nominal terms, this indicates a continuing decrease in construction activity in the capital. Low consumer and business confidence means that growth in construction activity will likely remain subdued over the short- to medium-term.