
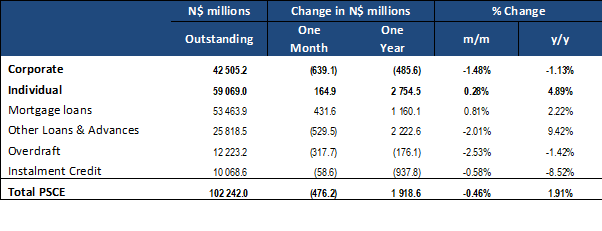
Overall
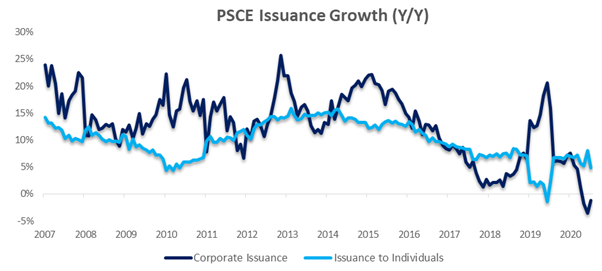
Total credit extended to the private sector (PSCE) decreased by N$476.2 million or 0.46% m/m in July, bringing the cumulative credit outstanding to N$102.24 billion. On a year-on-year basis, private sector credit increased by 1.9% y/y in July, compared to 2.3% y/y in June. This represents the second-lowest level of annual growth on our records dating back to 2002. On a rolling 12-month basis, N$1.919 billion worth of credit was extended to the private sector. Of this cumulative issuance, individuals took up N$2.755 billion, while corporates decreased their borrowings by N$485.6 million. The non-resident private sector paid back N$350.25 million of total outstanding loans and advances.
Credit Extension to Individuals
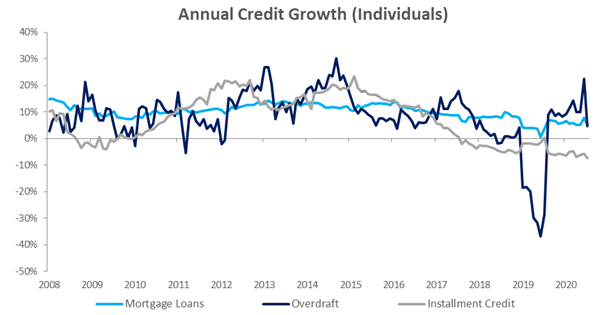
Credit extended to individuals showed slowed slightly in July, increasing by and 0.3% m/m and 4.9% y/y. The decrease was largely due to a month-on-month drop in overdrafts outstanding, which declined by 3.4% m/m and grew by only 4.6% y/y. Instalment credit continues to slow, showing zero growth in July and declining by 7.3% y/y or N$502 million. This is largely due to low vehicle sales, which have contracted by 24.8% y/y on a 12-month cumulative basis. Mortgage loans continued to show resilience and were up 0.6% m/m and 5.0% y/y. This translates to a 12-month cumulative issuance of N$1.958 billion over the last twelve months underpinning overall credit extension. However, the other loans and advances category, comprising of shorter-term credit such as personal and card loans, was a major driver of growth increasing by 14.4% y/y adding N$1.119 billion to the total 12-month cumulative issuance.
Credit Extension to Corporates
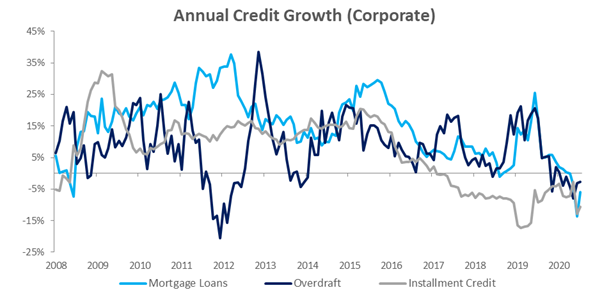
Credit extended to corporates continued to slow in nearly all the categories as corporates continue to delever, delivering the third month of year-on-year contraction. Total credit extended to corporates decreased by 1.5% m/m and 1.1% y/y, bringing the cumulative 12-month decrease in credit extended to corporates to N$485.6 million. Although showing a growth of 1.5% m/m, mortgage loans were still down by 5.9% y/y. Instalment credit contracted by 1.5% m/m and 10.6% y/y while overdrafts were down by 2.3% m/m and 2.7%y/y. Other loans and advances was the only subcategory which increased on an annual basis, growing by 6.7% y/y and declining by 3.1% m/m.
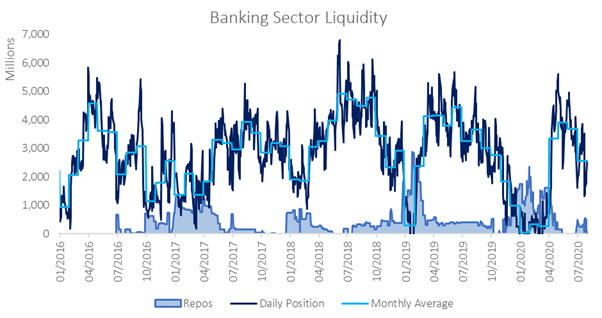
Banking Sector Liquidity
The average liquidity position of commercial banks declined sharply in July, decreasing by N$1.105 billion to an average of N$2.567 billion. According to the Bank of Namibia, this was primarily due to seasonal corporate tax payments. The value of repurchase transactions increased towards the end of the month but dropped to N$87.5 million by month-end.
Reserves and Money Supply
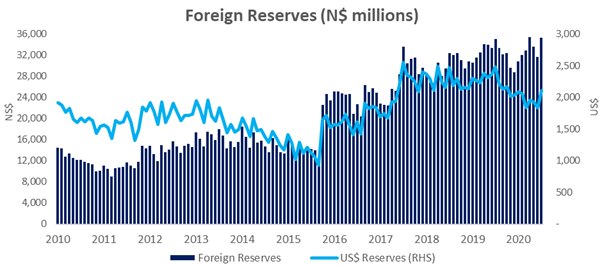
Broad money supply rose by N$15.06 billion or 13.9% y/y in July, as per the BoN’s latest monetary statistics release. Foreign reserve balances increased notably in July, up 11.5% m/m or N$3.641 billion to a total of N$35.40 billion. According to the BoN, the rise was primarily due to SACU receipts and the third tranche of the AfDB loan disbursed to the Namibian Government during the period under review. Seeing as the Namibian dollar also strengthened relative to the USD from an average of N$17.31 in June to N$16.81 in July, the US dollar value of our reserves increased by 15.0% to US$2.109 billion.
Outlook
Private sector credit extension growth remains subdued at the end of July, down slightly to 1.9% y/y from 2.3% y/y in June. Rolling 12-month issuance has declined to N$1.92 billion, down 72.3% from the N$6.91 billion figure as at July 2019. Lending to individuals has been relatively robust, given the circumstances, showing some growth in the mortgage segment. However, the sharp increase in other loans and advances should be viewed with caution, as this likely indicates that most consumers remain very stretched. On the other hand, the decline is most evident in the corporate sector as economic activity remains muted and businesses remain very cautious during the uncertainty surrounding the pandemic. Current expectations are for interest rates to remain at the current low levels for at least the next 12 months, however low-interest are not enough to spur on lending at the moment and corporates are decreasing their long term debt. Overall, there are very few catalysts for growth at the moment and while uncertainty looms investment will continue to suffer. As a result we not expect to see a recovery in credit extension in the medium term.


