NCPI – February 2019

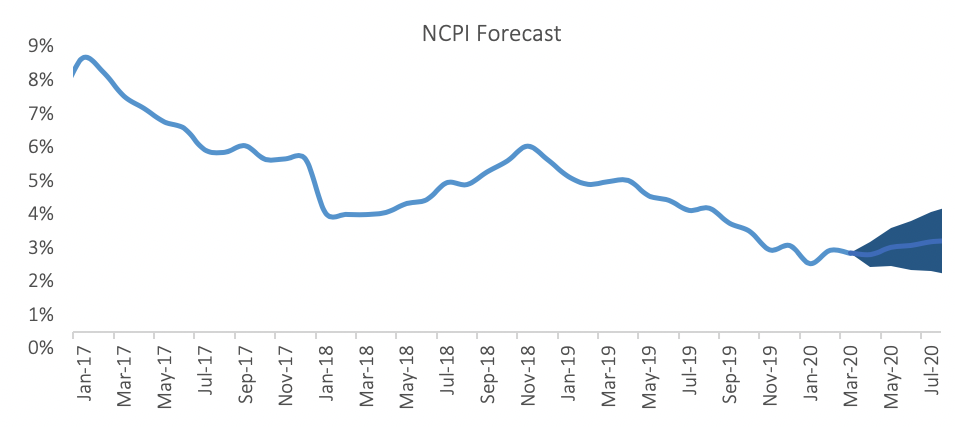
The Namibian annual inflation rate moderated slightly to 4.4% y/y in February, following the 4.7% y/y increase in prices recorded in January. Prices in the overall NCPI basket decreased 0.1% m/m. On a year-on-year basis, overall prices in seven of the twelve basket categories rose at a quicker rate in February, while four categories recorded slower rates of inflation and one category posted steady inflation. Prices for goods increased by 4.3% y/y while prices for services increased by 4.6% y/y.

Food & non-alcoholic beverages, the second largest basket item by weighting, was once again the largest contributor to annual inflation, accounting for 1.0% of the 4.4% annual inflation rate. The basket category recorded price increases of 0.4% m/m and 5.9% y/y in February, versus the 1.7% m/m and 5.7% y/y increases recorded in January. Prices in all thirteen sub-categories recorded increases on a year-on-year basis with the largest increases being observed in the prices of vegetables, fruits, and bread and cereals.

Transport, the third largest basket item, was the second largest contributor to annual inflation. Prices for transport rose by 7.5% y/y in February, marginally faster than the increase of 7.3% y/y recorded in January. The purchase of vehicles subcategory saw price increases of 0.9% m/m and 5.0% y/y. The cost of operation of personal transport equipment recorded an increase of 5.2% y/y. Oil prices increased by 6.4% in February, reaching US$57 a barrel at the end of the month as OPEC cut its output to a nearly four-year low, according to a survey by S&P Global Platts. The Ministry of Mines and Energy however decided to keep fuel pump prices unchanged for the month.

Prices for the alcoholic beverages and tobacco category was the third highest contributor to the annual inflation rate in February, and increased at a rate of 0.3% m/m and 6.2% y/y. Prices of alcoholic beverages increased at a rate of 6.5% y/y while tobacco prices increased at a rate of 4.9% y/y.

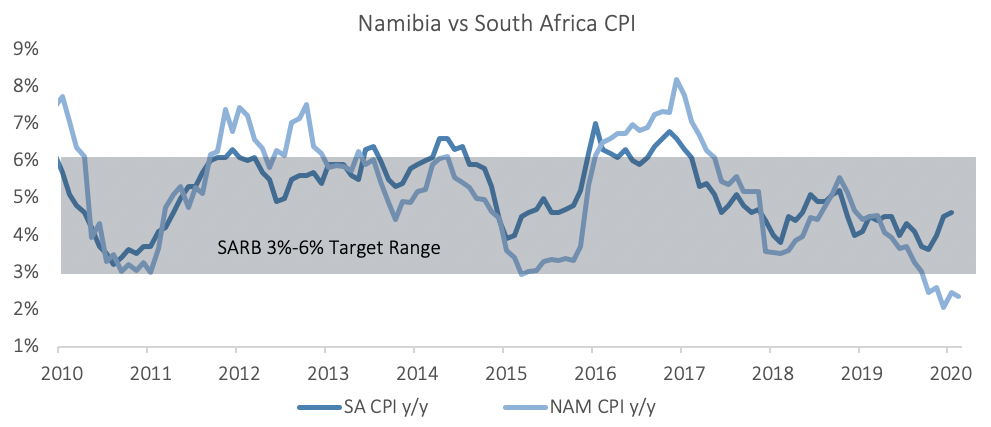
The Namibian annual inflation rate of 4.4% is currently trending somewhat higher than neighbouring South Africa’s January figure (latest available release) of 4.0%. Namibia’s inflation was mainly driven by food inflation, as the second-round effects caused by increases in transport inflation towards the end of last year and poor rainfall throughout the country during the first half of the 2019 rainfall season continue to push up food inflation.

Although the Ministry of Mines and Energy decided to keep fuel pump prices unchanged for March, we expect the Ministry to start hiking prices sometime in the coming months as oil prices have been picking up steadily since the beginning of the year. Inflation expectations will further be driven by exchange rates, with the rand having weakened since the beginning of February.

NCPI – January 2019

The Namibian annual inflation rate edged lower for a second consecutive month, moderating to 4.7% y/y in January, following December’s 5.1% y/y increase in prices. Prices in the overall NCPI basket increased 1.2% m/m, the largest monthly increase in prices over the last twelve months. It has become the norm for rental price adjustments to be passed through in January, which explains the elevated monthly inflation rate. On a year-on-year basis, overall prices in four of the twelve basket categories rose at a quicker rate in January than in December, while six categories recording slower rates of inflation, and two categories recorded unchanged inflation rates. Prices for goods increased by 4.2% y/y while price increases for services slowed to 1.9% y/y in January from 4.9% y/y in December.

The effects of the accelerated pace at which transport prices increased since July 2018 have now passed-through to food prices. Food & non-alcoholic beverages (FNAB) and transport, the second and third largest basket items by weighting, respectively, were equally the largest contributors to annual inflation in January. Together these basket categories accounted for 2.0% of the total 4.7% annual inflation rate. Prices for the FNAB basket increased by 1.7% m/m and 5.7% y/y in January, while prices for transport decreased by 2.6% m/m but increased 7.3% y/y. Prices in all thirteen FNAB sub-categories recorded increases on a year-on-year basis with the largest increases being observed in the prices of vegetables, fruits, bread and cereals.

rices in two of the three transport sub-categories recorded slower annual price increases compared to December, while prices in the one sub-category increased at a quicker pace in January. Price increases relating to the purchase of vehicles slowed to 6.0% y/y in January compared to 6.8% y/y in December, while prices related to public transportation services increased by 18.6% y/y owing to the increases in taxi and bus fares in September.

The operation of personal transport equipment sub-category saw prices decrease by 2.8% m/m but increase 10.5% y/y. This month-on-month decrease in the costs of operating personal transportation can be attributed to the decrease in fuel pump prices enacted by the Ministry of Mines and Energy (MME) in January. The MME cut unleaded petrol and diesel prices in January by 90 c/l and 100 c/l, respectively, thus extending motorists more relief following fuel pump price cuts in December.


Alcoholic beverages and tobacco prices, making up approximately 12.6% of the overall inflation basket, was the third highest contributor to the annual inflation rate in January. Accelerated increases in the prices for both the alcohol and tobacco sub-categories were observed in January, with alcohol prices increasing by 6.7% y/y and tobacco prices increasing by 5.3% y/y.

The Housing and utilities category bears the largest weighting in the CPI basket, but the year-on-year rate of price increases for this category has been slowing since November last year. Prices increased by 1.9% m/m for this category which is a result of annual rental adjustments being put through every January. Year-on-year, price increases slowed to 2.9% y/y in January (the lowest since December 2015) following a 3.1% y/y increase in December. Prices for the rental payments for dwellings sub-category increased by 2.3% y/y in January while prices for regular maintenance and repairs increased by 3.3% y/y. Price increases in the electricity, gas and other fuels subcategory were relatively muted at 4.8% y/y compared to 4.9% y/y in December.

Easing fuel pump prices continue to afford the Namibian consumer some relief and can be seen in the Namibian annual inflation rate moderating from 5.1% y/y to 4.7% y/y in January. Although slightly higher than in December, lower oil prices have contributed towards curbing rising inflation. However, risks to the inflation outlook exist. Food inflation, which was the highest contributing basket item in January, could continue to rise at an accelerated pace as poor rainfall since the start of Namibia’s rainy season (ending in April) affects local food production. The resultant shortfall will necessitate an increase in imports that will lead to higher food inflation. Increased uncertainty in food security is most likely to offset any gains from easing transport inflation.

The Bank of Namibia (BoN) recently left rates unchanged when the MPC met on the 13th of February. In its policy statement, the BoN estimates that inflation will average 5.6% in 2019. Significantly higher than the 4.3% that annual inflation averaged in 2018, and likely hinged on a probable rise in food inflation. However, the BoN’s policy decisions are driven by the level of international reserves which the BoN currently estimates sufficient, at 4.2 months of import cover, to protect the currency peg with the rand. The BoN will remain mindful of the SARB’s rate path in 2019, with SA inflation expectations being the key focus of the SARB. SA inflation is expected to be contained well within the SARB’s 3% – 6% target band, pushing the likelihood of steady interest rates for 2019 increasingly higher. This would allow the BoN to keep monetary policy accommodative for as long as the SARB does the same.

NCPI – December 2018

The Namibian annual inflation rate moderated to 5.1% y/y in December, following the 5.6% y/y increase in prices recorded in November. Prices in the overall NCPI basket decreased 0.2% m/m. The annual average inflation rate for 2018 was 4.3%, compared to 6.2% in 2017. On a year-on-year basis, overall prices in five of the twelve basket categories rose at a quicker rate in December than in November, with four categories recording slower rates of inflation and three categories remained unchanged. Prices for goods increased by 5.3% y/y while prices for services increased by 4.9% y/y.

Transport, the third largest basket item, was the largest contributor to annual inflation, accounting for 1.5% of the total 5.1% annual inflation rate. Prices for this basket item decreased by 1.8% m/m, but increased 10.9% y/y in December. Prices in all three sub-categories recorded increases on a year-on-year basis. Prices relating to the purchase of vehicles increased at a rate of 6.8% y/y, while prices related to public transportation services increased by 18.2% y/y due to the increases in taxi and bus fares in September.

The operation of personal transport equipment saw a price decrease of 2.8% m/m but an increase of 10.5% y/y. The month-on-month price decrease for this subcategory is a result of the cut in fuel pump prices announced by the Ministry of Mines and Energy at the beginning of December. The minister cut the price of unleaded and diesel by 100 cents per litre and 40 cents per litre, respectively, due to a decrease in the global oil price.

The price of Brent Crude oil increased by more than 20% in the first half of 2018, and hit a four-year high of US$86.29 per barrel in October. The price of oil has since fallen about 30% due to rising inventories and rapidly rising shale oil production in the US. Although the oil price has recovered somewhat from the beginning of the year, it continues to be weighted down by weaker economic growth forecasts in China.

Food and non-alcoholic beverages accounted for 0.9% of the total annual inflation rate. Food inflation is currently running at 5.2% y/y, up from the 4.7% y/y figure seen in November. The sub-categories of food and non-alcoholic beverages showed relatively low monthly increases, while six of the sub-categories showed monthly decreases. Prices of mineral waters, soft drinks and juices decreased by 1.8% m/m, while the prices of other non-alcoholic beverages declined 1.0% m/m in December. On an annual basis, prices of vegetables and fruits increased 12.8% y/y and 8.1% y/y respectively. Bread and cereal prices rose 7.9% y/y. The slow increase in meat, fish, and soft drink and mineral water prices helped keep food inflation tethered within low- to mid-single-digit levels for the year.

The Housing and utilities category was the third largest contributor to annual inflation due to its large weighting in the basket. Prices for this category remained flat m/m and increased 3.1% y/y. Prices in the electricity, gas and other fuels subcategory increased 4.9% y/y, significantly slower than the inflation of 8.7% recorded in November, due to base effects. The regular maintenance and repair of dwellings subcategory registered an increase in prices of 2.5% y/y although prices decreased by 0.7% m/m. This follows a 0.3% decrease in prices in this category in November.

The moderation in the Namibian annual inflation rate to 5.1% was somewhat expected given the cut in fuel pump prices in December. We expect transport inflation to continue its slower growth rate on an annual basis in the short-term due to the further fuel pump price cut in January, relatively low oil prices, and the stronger exchange rate. The above-mentioned factors hold true for South African inflation too and as such filter into the SARB’s Monetary Policy Committee forecasts and decisions. Relief from lower oil and fuel prices should lead to a slightly more dovish SARB, all else equal, which is likely to lead to interest rates being left unchanged later this week when the SARB MPC meets.

Local food prices might increase going forward if imports of cloven-hoofed animals and their products remain banned for some time due to the outbreak of foot-and-mouth disease in the Limpopo province in South Africa.