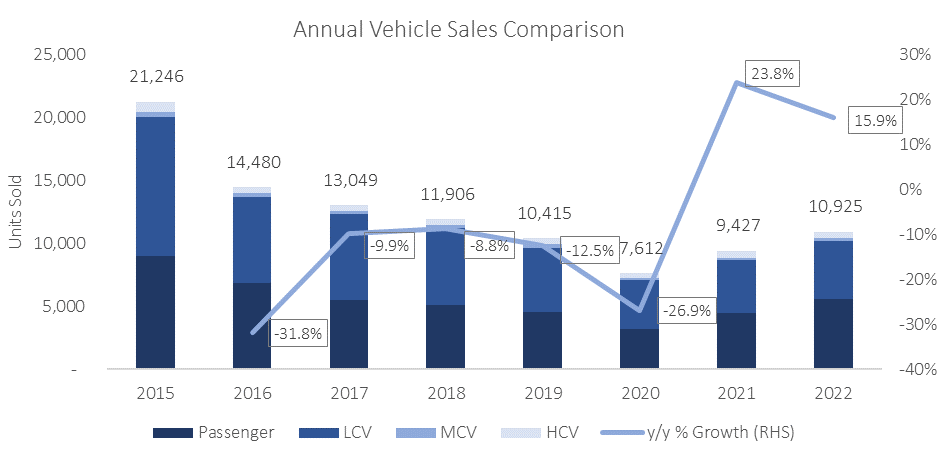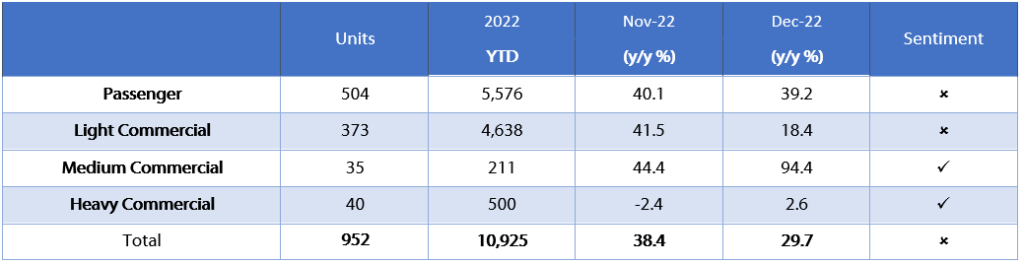
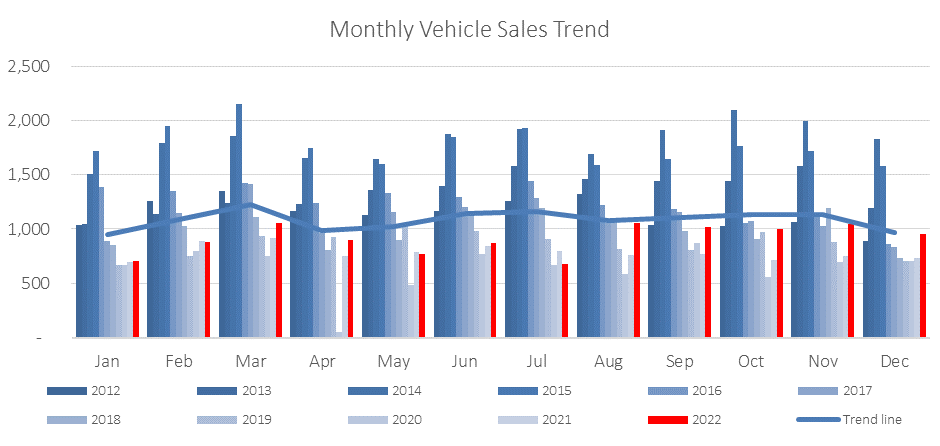
A total of 952 new vehicles were sold in December, down 8.9% m/m from the 1,045 vehicles sold in November, but an increase of 29.7% y/y from the 734 vehicles sold in December 2021. In total, 10,925 new vehicles have been sold in 2022, up by 15.9% y/y from the 9,973 vehicles sold in 2021 and the highest annual number of new vehicles sold since 2019. Of the total vehicles sold during the year, 5,576 were passenger vehicles, 4,638 light commercial vehicles, and 711 medium and heavy commercial vehicles.
504 new passenger vehicles were sold during November, 27 fewer than the 531 sold a month earlier, but an increase of 39.2% y/y from the 362 vehicles sold in December 2021. Toyota was the best seller in this segment after accumulating 31.3% of the sales in December. Volkswagen came in second place with 15.5% of December’s new passenger vehicle sales, followed by Land Rover which saw 65 new vehicles sold – notably more than it has sold for the whole of 2021. New passenger vehicle sales grew by 24.4% y/y in 2022 when compared to the 4,484 new vehicles sold a year prior. With 5,576 new vehicles sold in 2022, the year ended with the highest annual number of passenger vehicles sold since 2016.
448 new commercial vehicles were sold in December, 66 fewer than in November but up by 20.4% y/y from the 372 vehicles sold in December last year. Light commercial vehicle sales dropped by 16.6% m/m to 373 but rose by 18.4% y/y. Medium commercial vehicle sales climbed for the sixth consecutive month, growing by 34.6% m/m to 35, the highest number of medium commercial vehicles sold in a single month since July 2019, and almost double the number sold in December 2021. Heavy commercial vehicle sales remained steady after 40 vehicles were sold, one fewer than last month and slightly below the 42 sold on average in 2022. In total, 4,638 light commercial vehicles were sold in 2022, up by 11.0% y/y from the 4,178 sold in 2021. The total number of medium commercial vehicles sold during the year grew by 3.9% y/y after 211 vehicles were sold in this segment in 2022. The total number of heavy commercial vehicles sold in 2022 however contracted by 11.0% y/y to 500.
Toyota was the best seller in the new passenger vehicle sector with 33.0% of the segment’s sales in 2022. This a remarkable feat considering that Toyota had production challenges on some of their key models due to flood damage at its plant in KwaZulu-Natal for an extended period during the year. Volkswagen was the runner-up with 20.9% of the market share, followed by Kia and Suzuki with 9.3% and 7.5% of the market share, respectively. The other manufacturers, including Hyundai and Haval, consumed the remaining 29.4%.
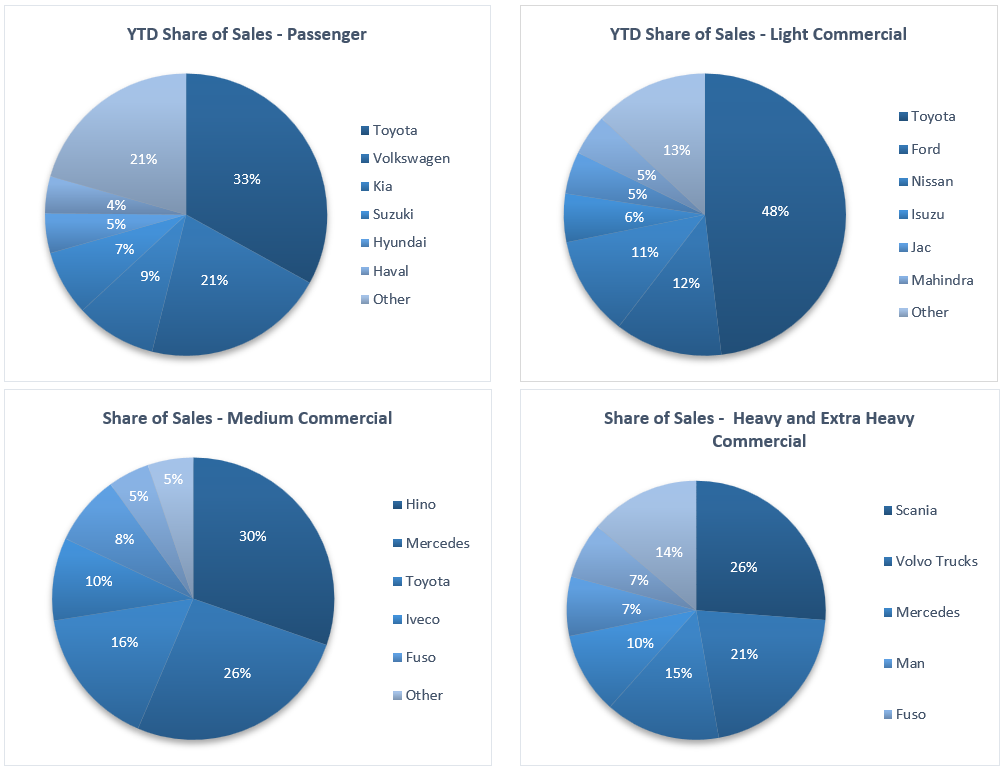
Toyota was also the top seller in the light commercial vehicle space with 48.1% of the segment’s sales in 2022, followed by Ford with 12.3% of the market share and Nissan with 11.4%. Hino was the best seller in the medium commercial vehicle segment with 30.3% of the segment’s sales in 2022, followed by Mercedes with 26.1% of the market share and Toyota with 16.1%. In the heavy and extra-heavy commercial vehicle market, Scania came out on top with 26.2% of the market share in 2022, followed by Volvo Trucks with 21.0% of the market share and Mercedes with 14.4%.
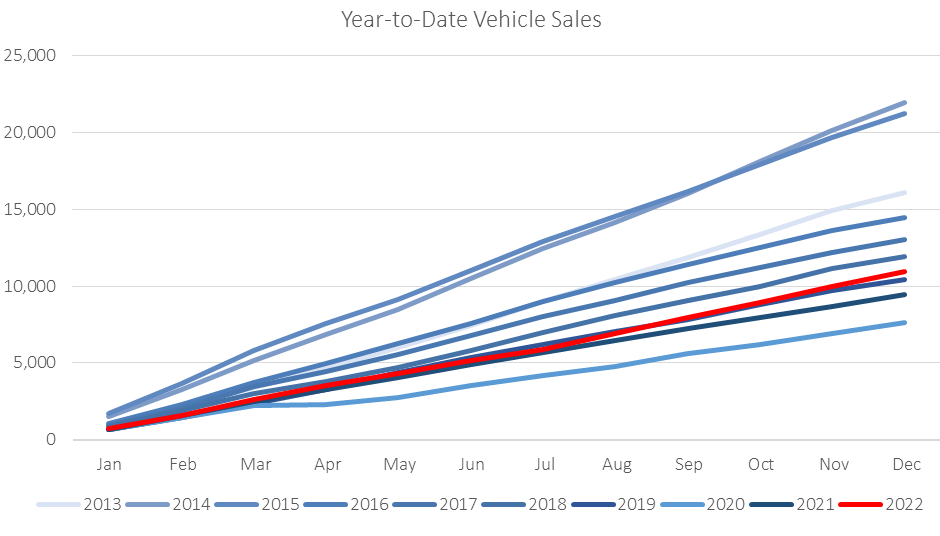
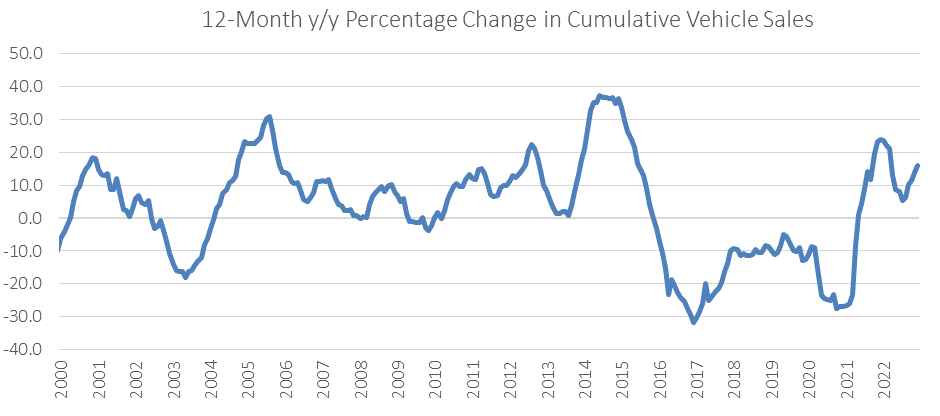
The 952 vehicles sold in December was the highest number recorded for the month of December since 2015 and pushed the total annual vehicle sales number to pre-pandemic levels, and above the 10,000 level for the first time since 2019, as shown in the year-to-date chart at the beginning of this post. Both passenger and commercial vehicle sales recorded strong growth in 2022. Sales in the heavy commercial vehicle segment contracted in 2022, following a strong recovery in 2021, while the light and medium commercial vehicle segments reported healthy sales growth for the year. Overall, the recovery of new vehicle sales in 2022 was remarkable to see against a backdrop of rising interest rates, and despite being a challenging economic year. But new vehicle sales continue to trail the levels seen prior to 2019 as the chart below depicts.