Overall
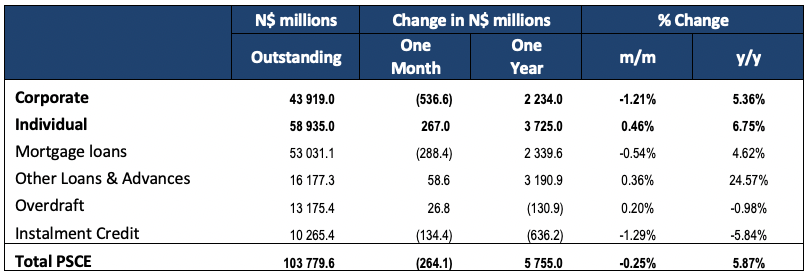
Private sector credit (PSCE) decreased by N$264.0 million or 0.25% m/m in February, bringing the cumulative credit outstanding to N$103.8 billion. On a year-on-year basis, private sector credit extension increased by 5.87% in February, compared to 6.96% y/y in January. On a rolling 12-month basis, N$5.76 billion worth of credit was extended to the private sector. Of this cumulative issuance, individuals took up credit worth N$3.73 billion, while N$2.23 billion was issued to corporates. The non-resident private sector decreased their borrowings by N$204.0 million.
Credit Extension to Individuals
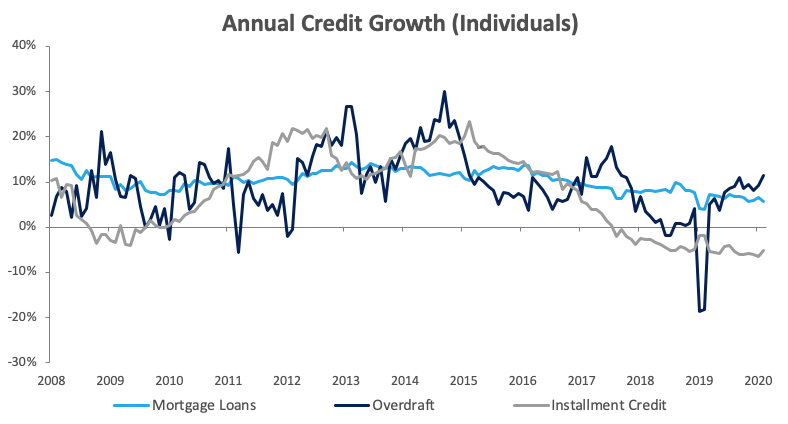
Credit extended to individuals increased by 6.7% y/y in February, growing at a slightly slower pace than the 7.0% y/y increase recorded in January. On a monthly basis, household credit grew by 0.5% following the decrease of 4.4% m/m recorded in January. Household demand for overdraft facilities was relatively strong in February, increasing by 2.7% m/m and 11.4% y/y, compared to the 18.1% m/m decline and 9.2% y/y increase seen in January. The value of mortgage loans extended to individuals fell by 0.1% m/m, but rose 5.7% y/y. Installment credit remained depressed, increasing by 0.9% m/m, but contracting by 5.1% y/y.
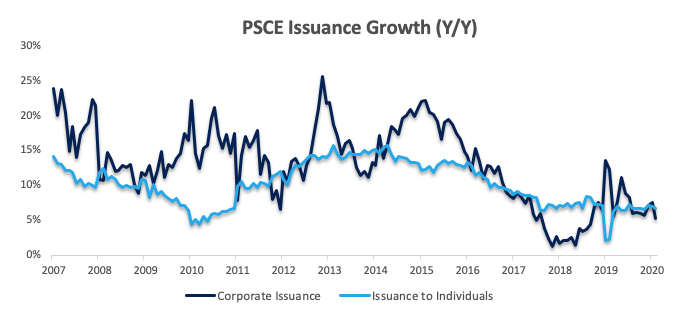
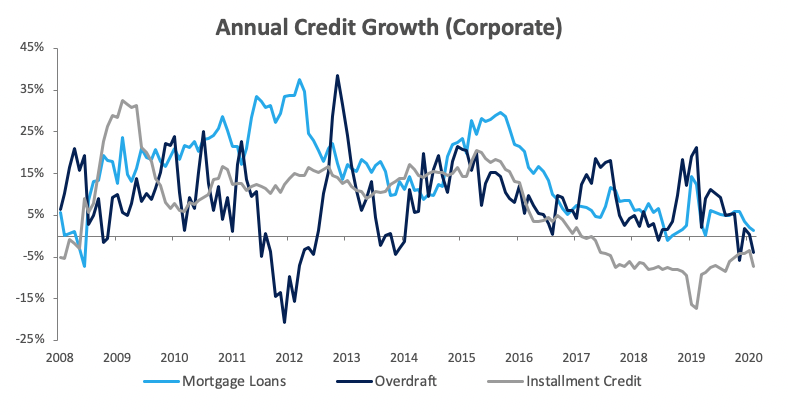
Credit Extension to Corporates
Credit extension to corporates contracted by 1.2% m/m after increasing by 7.3% m/m in January. On an annual basis, however, credit extension to corporates increased by 5.4% y/y in February, compared to the 7.5% y/y growth registered in January. The Bank of Namibia (BoN) attributed the monthly contraction to repayments made by corporates, especially those operating in the services, construction and fishing sectors. Overdraft facilities extended to corporates declined by 0.5% m/m and 3.9% y/y. Mortgage loans to corporates decreased by 1.9% m/m, but rose 1.4% y/y. Installment credit extended to corporates, which has been contracting since February 2017 on an annual basis, remained depressed, contracting by 5.1% m/m and 7.2% y/y in February. Leasing transactions to corporates fell by 4.9% m/m and 7.2% y/y.
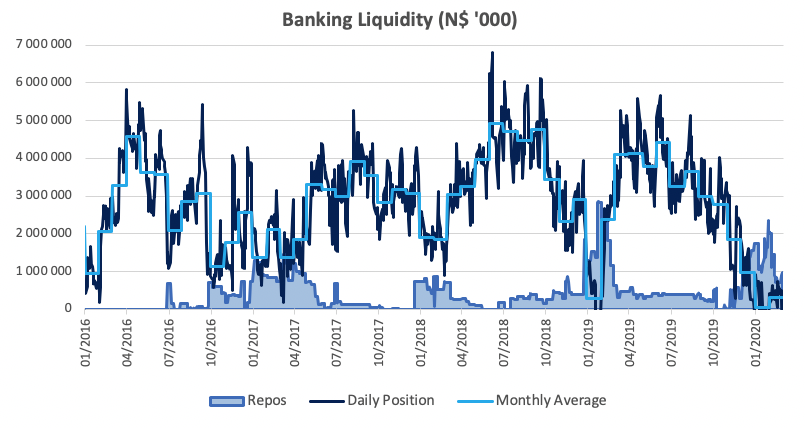
Banking Sector Liquidity
The overall liquidity position of commercial banks improved somewhat during February, increasing by N$278.2 million to reach an average of N$325.9 million. Commercial banks continued to utilize the BoN’s repo facility, as the overall liquidity position remained low. The balance of repo’s outstanding decreased from N$2.04 billion at the start of February to N$974.1 million at the end of the month.
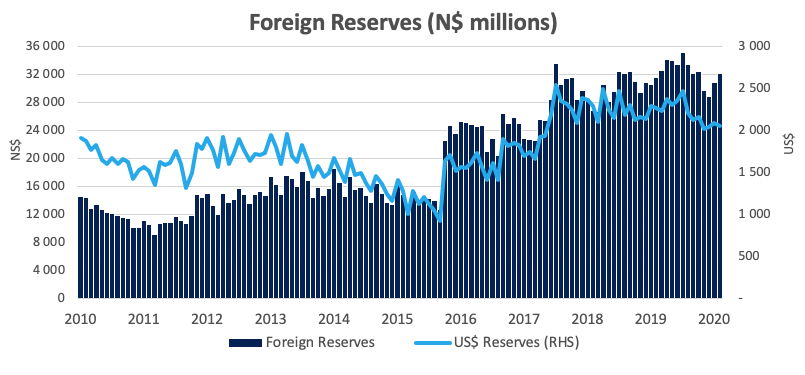
Reserves and Money Supply
As per the BoN’s latest money statistics release, broad money supply fell by N$816.1 million in February. Foreign reserve balances increased by N$1.21 billion to N$32.7 billion in February. According to the BoN, the increase mainly as a result of exchange rate fluctuations coupled with lower government payments during the month.
Outlook
Overall PSCE growth moderated for the first time in four months on a year-on-year basis, increasing by 5.87%. Rolling 12-month private sector credit issuance is down 10.0% from the N$6.39 billion issuance observed at the end of February 2019, with individuals taking up most (64.7%) of the credit extended over the past 12 months.
The above data precedes the economic impact of the coronavirus pandemic which we expect to have a detrimental impact on PSCE going forward. While the BoN’s MPC’s unexpected ‘early’ repo rate cut in March is likely to provide relief to heavily indebted consumers, we don’t anticipate that the more accommodative monetary policy will be effective in stimulating economic activity to the extent that it eliminates the impact of the external shock to the economy.
Given the 21-day lockdown of the two most economically significant regions announced by the Namibian government, we expect both consumers and businesses to increase their uptake of short-term debt going forward as a means of making ends meet, as most economic activity (and subsequently income) grinds to a halt while expenditure will still need to be covered.