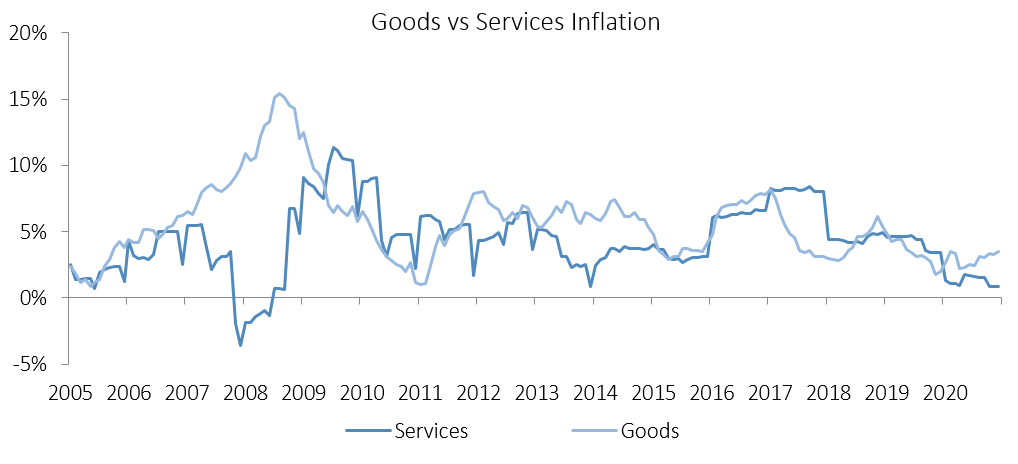
The Namibian annual inflation rate increased marginally to 2.4% y/y in December, following the 2.2% y/y increase in prices recorded in November. Prices in the overall NCPI basket remained steady on a month-on-month basis, an indication of the subdued inflationary pressure currently being experienced. The annual average inflation rate for 2020 was 2.2%, compared to 3.7% in 2019 and 4.3% in 2018. On a year-on-year basis, overall prices in five of the twelve basket categories rose at a quicker rate in December than in November, with four categories recording slower rates of inflation and three categories recorded consistent with the prior month. Prices for goods increased by 3.5% y/y while prices for services increased by 0.9% y/y.
As it has been the case for the majority of the year, the food & non-alcoholic beverages category was the largest contributor to annual inflation in December, accounting for 1.3 percentage points of the total 2.4% annual inflation rate. Price inflation for this category came in at 0.1% m/m and 7.6% y/y, the highest annual figure since February 2017. Prices in all thirteen sub-categories recorded increases on an annual basis with the largest being observed in the prices of fruits which increased by 17.7% y/y and oils and fats which increased by 12.2% y/y.
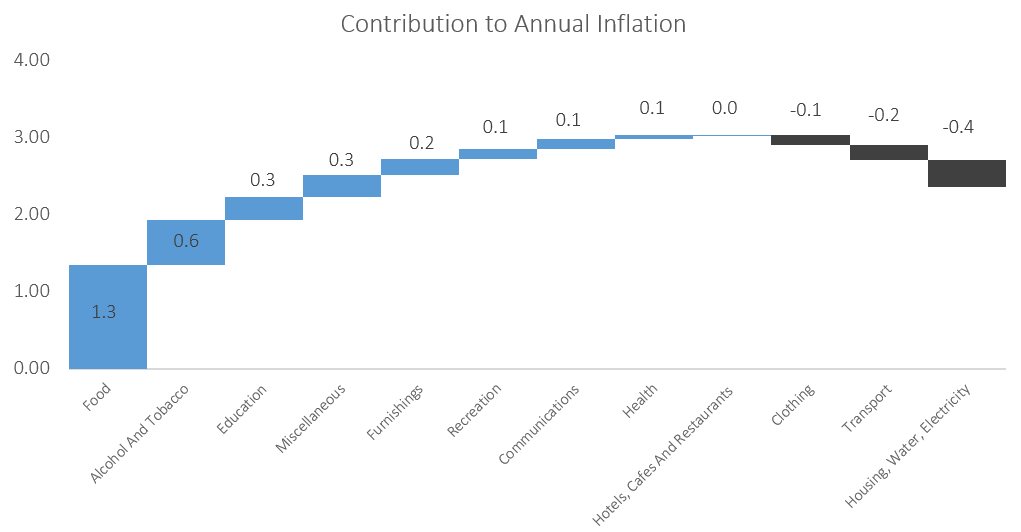
The alcoholic beverages and tobacco basket item, the third-largest basket item by weighting, was the second-largest contributor to the annual inflation rate in December. The category displayed a price decrease of 0.4% m/m, but an increase of 4.3% y/y. Prices for alcoholic beverages decreased at a rate of 0.5% m/m, but rose 3.2% y/y, while tobacco prices fell by 0.2% m/m, but increased 9.3% y/y.
The education basket recorded inflation of 7.0% y/y, with the cost of pre-primary education growing at a rate of 5.6% y/y, while the primary and secondary education recorded price increases of 9.3% y/y. Tertiary education prices rose by 5.3% y/y. All three subcategories printed no price increases on a month-on-month basis.

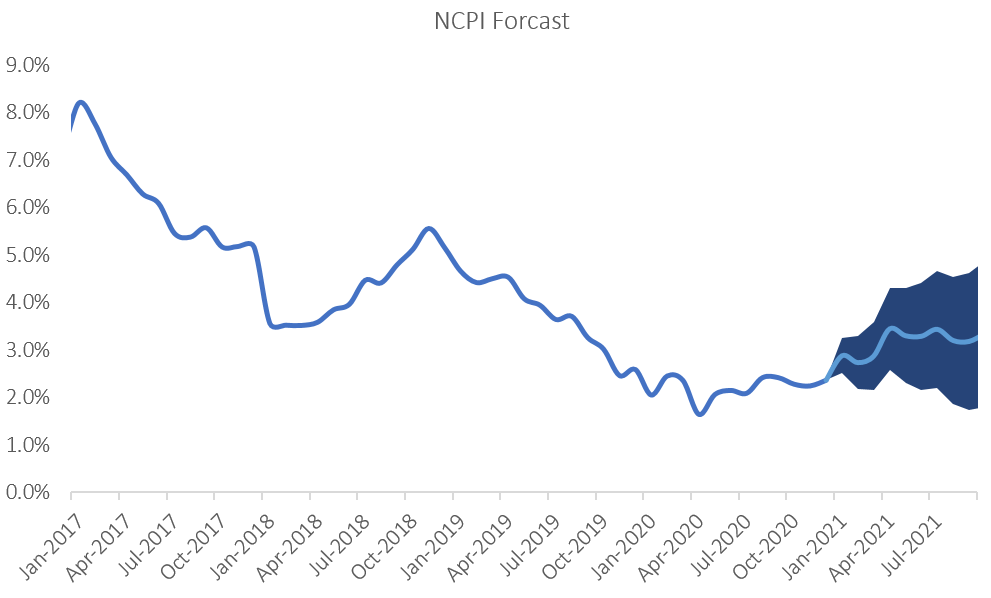
The Namibian annual inflation rate trended lower than that of neighbouring South Africa’s during the entire year. Inflationary pressure in Namibia has been particularly low since the outbreak of Covid-19 due to a lack of demand for both goods and services. The almost persistent inclusion of the education basket item, which has the 8th highest weighting, in the top contributors to inflation in 2020 is an indication of how subdued the inflationary pressure is. IJG’s inflation model forecasts an average inflation rate of 3.2% y/y in 2021 and 4.5% in 2022, thus indicating a steady increase in the inflation rate over the next two years. The largest upside risk to this forecast is higher food costs and fuel prices.