Twitter Timeline
[custom-twitter-feeds]
Categories
- Calculators (1)
- Company Research (303)
- Capricorn Investment Group (52)
- FirstRand Namibia (54)
- Letshego Holdings Namibia (26)
- Mobile Telecommunications Limited (8)
- NamAsset (3)
- Namibia Breweries (46)
- Oryx Properties (59)
- Paratus Namibia Holdings (7)
- SBN Holdings Limited (18)
- Economic Research (680)
- BoN MPC Meetings (14)
- Budget (19)
- Building Plans (147)
- Inflation (147)
- Other (28)
- Outlook (17)
- Presentations (2)
- Private Sector Credit Extension (145)
- Tourism (7)
- Trade Statistics (4)
- Vehicle Sales (148)
- Media (25)
- Print Media (15)
- TV Interviews (9)
- Regular Research (1,899)
- Business Climate Monitor (75)
- IJG Daily (1,702)
- IJG Elephant Book (12)
- IJG Monthly (108)
- Team Commentary (250)
- Danie van Wyk (61)
- Dylan van Wyk (27)
- Eric van Zyl (16)
- Hugo van den Heever (1)
- Leon Maloney (11)
- Top of Mind (4)
- Zane Feris (12)
- Uncategorized (7)
- Valuation (4,752)
- Asset Performance (120)
- IJG All Bond Index (2,223)
- IJG Daily Valuation (1,903)
- Weekly Yield Curve (505)
Meta
Category Archives: Economic Research
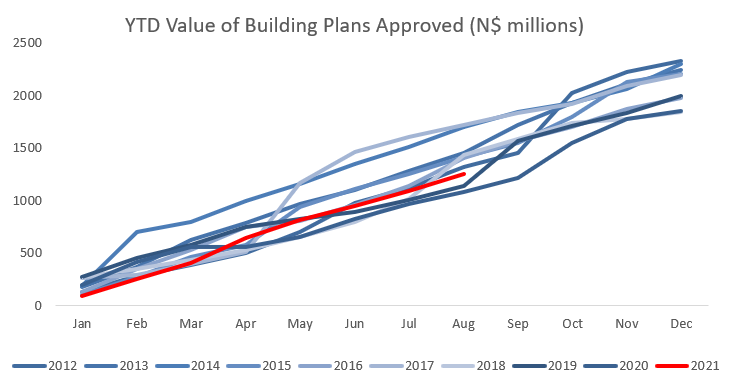
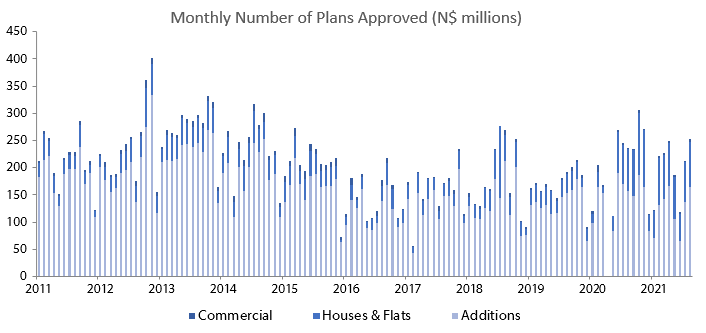
Building Plans – August 2021
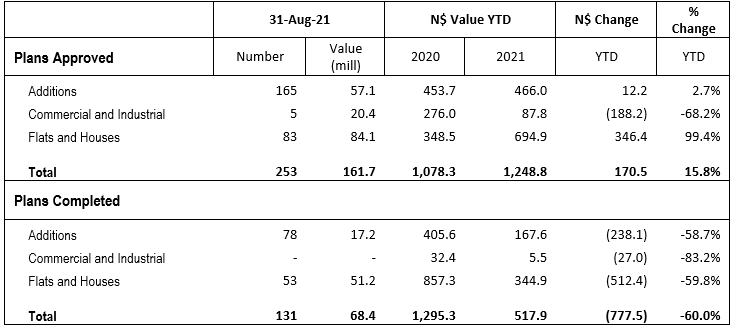
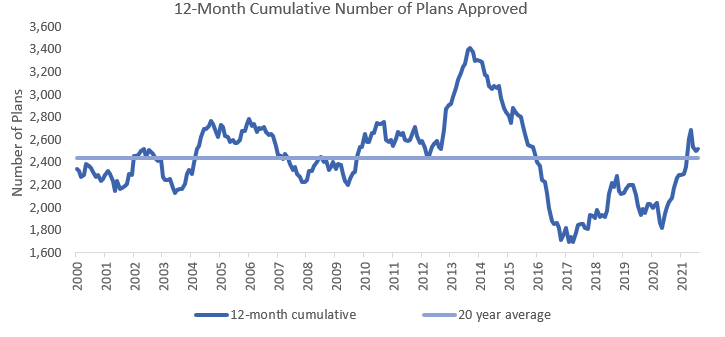
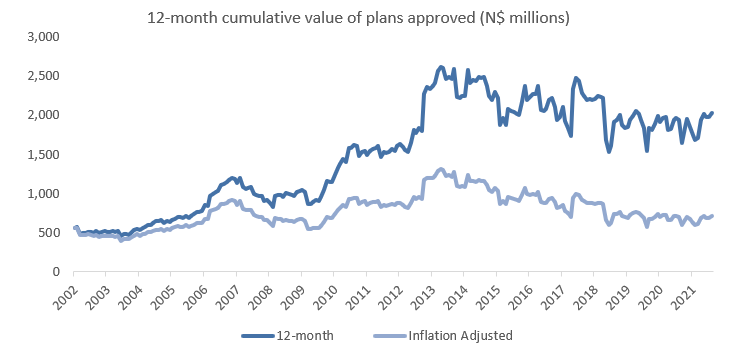
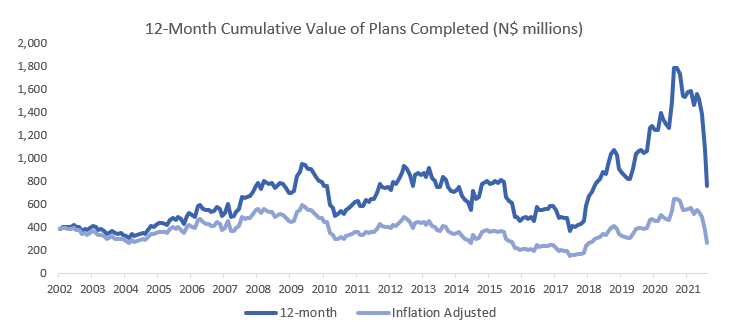
The City of Windhoek approved 253 building plans in August, a 19.9% m/m increase from the 211 approved in July. The value of approvals increased by 11.1% m/m to N$161.7 million. Year-to-date there have been 1,591 approvals, valued at N$1.25 billion, 15.8% higher in value terms and 17.3% higher in number terms than at the same time last year. On a 12-month cumulative basis, the number of building plan approvals rose by 22.8% y/y to 2,517 as the value of approvals rose by 4.5% y/y to N$2.02 billion. In August, 131 construction projects were completed at a value of N$68.4 billion. This is a marked increase from the number of completions in July when only 36 projects were completed, the second-lowest figure for the year. Year-to-date, 969 plans, valued at N$517.9 million have been completed, a 60.0% contraction in value terms compared to the same period a year ago.
Additions to properties made up 65% of total approvals in August. 165 additions were approved at a value of N$57.1 million, a 20.4% m/m increase in number, but a 12.0% m/m decrease in value from the N$64.9 worth of addition approvals in July. Year-to-date, 983 additions have been approved at a value of N$466.0 million, a 3.4% decrease in number, but a 2.7% increase in value terms. In August, 78 additions were completed at a value of N$17.18 million. Although the number and value of additions completed per month trend to vary widely – August’s figures sit close to the year-to-date averages.
New residential units were the second largest contributor to the total number of building plans approved with 83 approvals registered in August. In terms of value, the N$84.1 million worth of residential units approved in August represents a 4.7% m/m increase. Year-to-date 583 units worth N$694.9 million have been approved, double the value of residential approvals achieved this time last year. On a 12-month cumulative basis, the number of residential units approved increased by 123.1% y/y and 98.0% in value terms. 53 new residential units worth N$51.2 million were completed in August. This represents a year-to-date decrease in value of 59.8% compared to this time last August. On a 12-month cumulative basis, the number of residential units completed stands is 526 at a value of N$531.8 million. As such, the 12-month cumulative value of completed residential units decreased, by 45.1% y/y, for the first time in over a year.
In August five commercial units, valued at N$20.4 million, were approved. Year-to-date, 25 commercial buildings at a value of N$87.8 million have been approved. No commercial building projects have been completed since March. This is the longest run of zero completions in the commercial construction sector since independence. Commercial projects continue to be approved; they are not being completed.
On a 12-month cumulative basis, the number of buildings completed fell by 42.9% y/y, translating to a 57.4% y/y decrease in value. There is a simple, mechanical explanation for this. Namibia’s first hard lockdown of 2020 put a pause on all building projects. In April of that year no construction projects; be that additions, residential units or commercial projects were completed. This is likely to have created a glut of unfinished construction projects. As construction sites reopened, the following five months saw a massive spike in the value of completed projects. For example, in August of 2020 the value of completed construction projects was N$395.0 million – the most ever added in one month. This August’s figure for the 12-month cumulative value of completed construction projects is the first this year to not consider the large, distorted, values of completed projects from the May 2020 – September 2020 post-lockdown period. The 12-month cumulative value of plans completed now, despite the large decrease recorded this August, gives a more accurate picture of the short-term trends and current conditions in the Namibian construction industry.
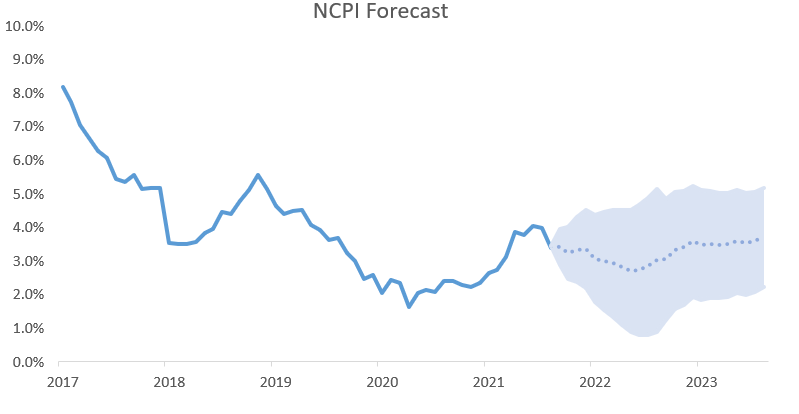
NCPI August 2021
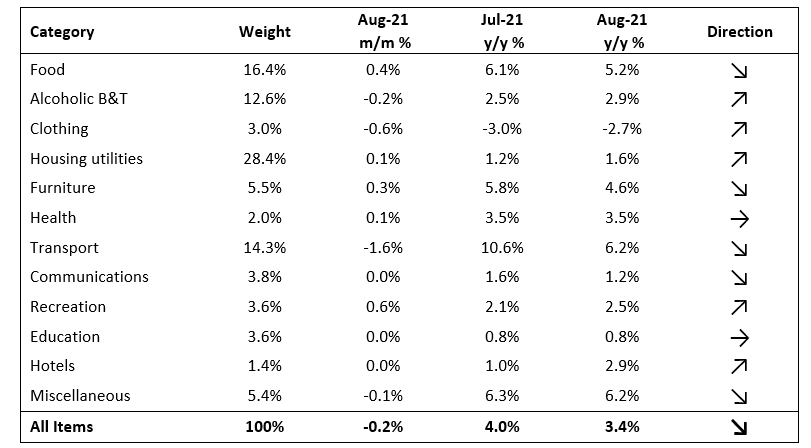
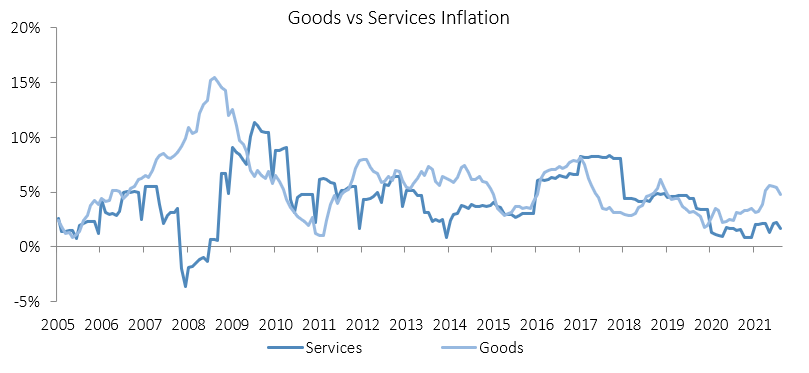
Namibian inflation slowed to 3.4% y/y in August on the back of a 4.0% y/y increase in prices in July. Accordingly, prices in the overall NCPI basket decreased by 0.2% m/m. On an annual basis, overall prices of five of the twelve categories rose at a quicker rate in August than July, while five categories experienced slower rates of inflation and two categories posted steady inflation. Tellingly, inflation in the food and non-alcoholic beverages category, which has the second largest weighting in the NCPI, slowed from 6.1% y/y in July to 5.2% y/y in August. Prices for goods increased by 4.8% y/y while prices for services increased by 1.7% y/y in August.
Predictably, food and non-alcoholic beverages, alongside transport, accounted for most of the 3.5% y/y increase in the NCPI in August. Food and non-alcoholic beverages contributed 1.0 percentage points while transport contributed 0.9 percentage points to the annual inflation figure. Prices in these categories are highly correlated, with increases in one category often predicting increases in the other. Prices for transport, the third largest basket item in weighting, decreased by 1.6% m/m in August. This is the largest month-on-month decrease of all categories in the NCPI. The NSA data, somewhat bizarrely, shows that the prices for public transportation services fell by 9.9% m/m and 8.7% y/y. No explanation was given for this decline.
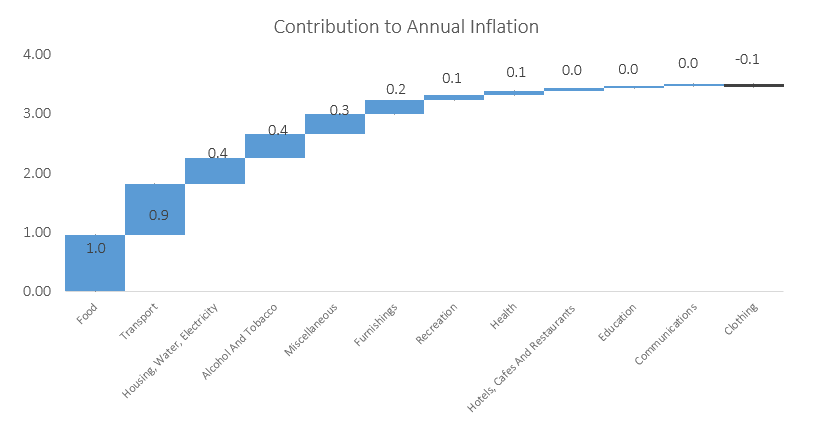
Housing, water and electricity contributed 0.4 percentage points to the annual inflation figure in August, recording an increase of 0.1% m/m and 1.6% y/y. The regular maintenance and repair of dwelling was the only sub-category which recorded a slower rate of increase at 8.3% y/y. The electricity, gas and other fuels and water supply, sewerage service and refuse collection sub-categories posted quicker inflation of 2.8% y/y and 1.4% y/y, respectively. Alcohol and tobacco products round off the top five biggest contributors to inflation this month alongside miscellaneous goods.
The 3.4% y/y inflation rate is exactly in line with IJG’s inflation forecast for the year. Risks remain to the upside, with the Delta variant threatening to slow economic growth in much of the world, coupled with microchip shortages threating the global supply of tech products and new vehicles as well as escalating shipping costs. However, significant price shocks are unlikely to materialise in short term given that businesses are unlikely to raise prices as consumer confidence and disposable income both remain low. IJG’s inflation model currently forecasts an average inflation of 3.4% y/y in 2021 and 3.0% y/y in 2022. Economic growth is likely to remain slow in the coming years and inflation is likely to remain muted.