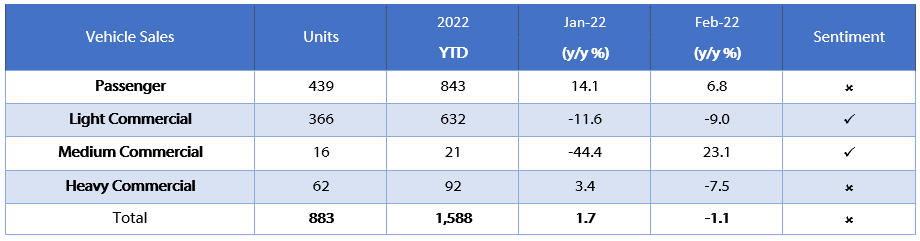
New Vehicle Sales – February 2021

897 New vehicles were sold in February, an increase of 28.4% m/m from the 694 vehicles sold in January, and a 11.7% y/y increase from the 798 sold in February 2020. For the first two months of 2021 1,585 new vehicles have been sold, of which 764 were passenger vehicles, 703 light commercial vehicles, and 118 medium and heavy commercial vehicles. By comparison, the first two months of 2020 saw 1,470 new vehicles sold. 2021 is thus off to a slightly better start compared to last year. On a twelve-month cumulative basis, a total of 7,729 new vehicles were sold as at February 2021, representing a contraction of 26.0% from the 10,442 sold over the comparable period a year ago.

A total of 409 new passenger vehicles were sold during February, increasing by 15.2% from the 355 passenger vehicles sold in January. On a year-on-year basis, February new passenger vehicle sales 18.2% higher than the 346 vehicles sold a year ago. Year-to-date, passenger vehicle sales rose to 764, 19.6% higher than during the same period in 2020. On a rolling 12-month basis, passenger vehicle sales rose to 3,338, its highest level since April 2020. After three consecutive months of increases in this measure, early signs do seem to indicate as if the trough has been reached in the new passenger vehicle market.

A total of 482 new commercial vehicles were sold in February, representing an increase of 42.2% m/m and 6.6% y/y. 402 Light commercial vehicles, 13 medium commercial vehicles, and 67 heavy and extra heavy commercial vehicles were sold during the month. Light commercial vehicle sales rose 4.1% y/y, medium commercial vehicle sales dropped 38.1% y/y and heavy commercial vehicle sales increased by 48.9% y/y. On a twelve-month cumulative basis, light commercial vehicle sales have declined by 25.5% y/y, medium commercial vehicles fell by 41.8% y/y, and heavy commercial vehicles dropped 24.9% y/y.

Volkswagen enjoys a strong lead in the passenger vehicle sales segment with 40.3% of the segment sales year-to-date, followed by Toyota with 21.6% of the market share. The two top brands maintained their large gap over the rest of the market with Kia and Mercedes following with 6.0% and 5.5% of the market, respectively, leaving the remaining 26.6% of the market to other brands.

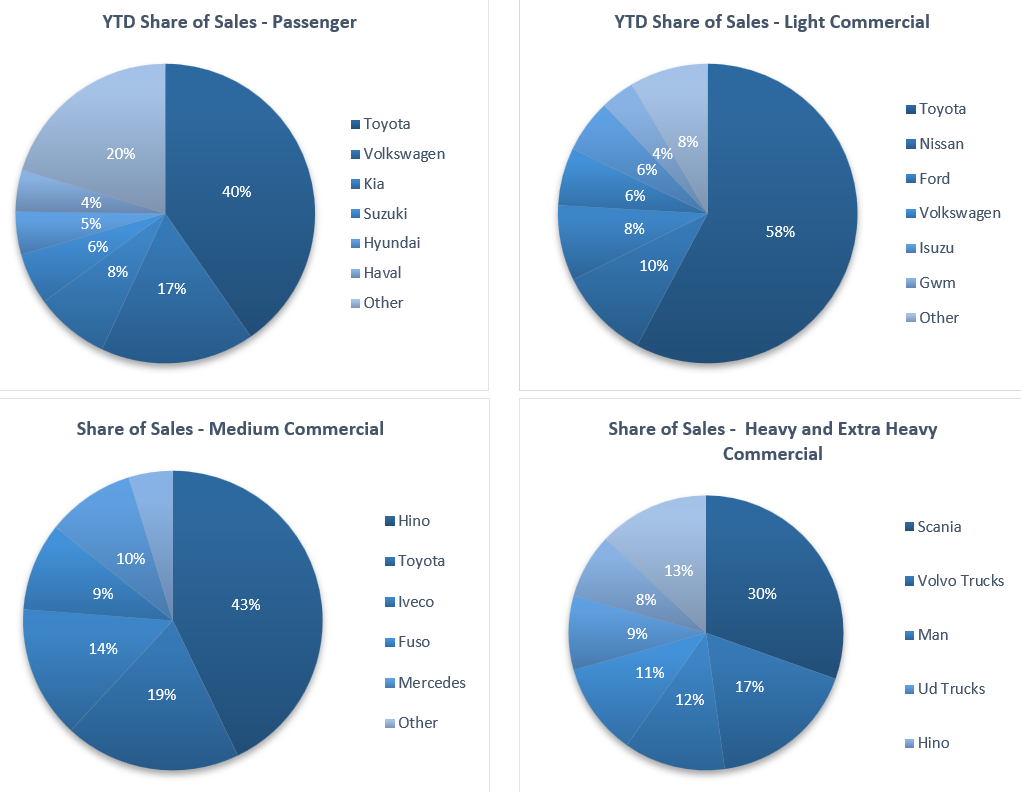
On a year-to-date basis, Toyota remained the leader in the light commercial vehicle space with a 51.5% market share, with Nissan in second place with a 14.9% market share. Ford and Isuzu claimed 12.7% and 6.5%, respectively, of the number of light commercial vehicles sold thus far in 2021. Hino leads the medium commercial vehicle segment with 27.3% of sales year-to-date, while Scania was number one in the heavy and extra-heavy commercial vehicle segment with 33.3% of the market share year-to-date.

The Bottom Line

February’s new vehicle sales figure of 891 was the highest number since October 2019, when 971 new vehicles were sold. The rolling 12-month number of new vehicle sales showed a small uptick for the second consecutive month to 7,729. The increase in new cumulative passenger vehicle sales is especially encouraging as it could indicate a slight increase in consumer confidence, although it is still early days. The growth in the last couple of months was likely driven by the extension of the payback period on vehicle financing from 54 months to 72 months in September 2020. . The growth is however from a very low base and overall 12-month cumulative sales is still down 66.4% from its peak in April 2015.

PSCE – January 2021

Overall

Private sector credit (PSCE) increased by N$224.1 million or 0.2% m/m in January, bringing the cumulative credit outstanding to N$105.6 billion. On a year-on-year basis, private sector credit grew by 1.50% y/y in January, on par with December’s increase of 1.58% y/y. Cumulative credit extended to the private sector over the last 12-months amounted to N$1.56 billion. Of this cumulative issuance, individuals took up N$1.4 billion worth of debt while N$428.8 million was extended to businesses. The non-resident private sector decreased its borrowings by N$312.9 million.

Credit Extension to Individuals

Credit extended to individuals fell by 0.7% m/m, but rose 2.5% y/y in January, growing at almost half the pace than the 4.5% y/y increase recorded in December. All categories recorded a contraction on a monthly basis. Individuals paid back overdrafts during the month, resulting in a 1.7% m/m decrease in this category, but rose 2.3% y/y. Instalment credit declined by 1.3% m/m, while mortgage loans extended to individuals contracted by 0.5% m/m.

Credit Extension to Corporates

Credit extended to corporates grew by 1.0% y/y in January, after contracting by 1.2% y/y in December. On a month-on-month basis, credit extension to corporates rose 1.3% in January. The month-on-month growth in corporate credit was primarily driven by increased uptake in overdraft facilities which registered growth of 3.7% m/m and 14.2% y/y. The Bank of Namibia indicated that this was mostly due to increased demand for short-term credit facilities to finance their working capital requirements during the month. Demand for instalment credit by corporates remained low, increasing by 1.5% m/m, but contracting 12.8% y/y. Mortgage loans to corporates, grew by 2.7% m/m, but contracted by 3.2% y/y, the lowest annual contraction rate in nine months.

Banking Sector Liquidity

The overall liquidity position of commercial banks deteriorated further during January, declining by N$474.3 million to reach an average of N$775.1 million. According to the Bank of Namibia, the decline is due to periodic corporate tax payments to the government. Commercial banks continued to utilize the BoN’s repo facility in January, with the balance of repo’s outstanding falling from N$1.04 billion at the start of January to N$845.7 million at the end of the month.

Reserves and Money Supply

Broad money supply rose by N$11.7 billion or 10.2% y/y in January, as per the BoN’s latest monetary statistics release. Foreign reserve balances increased notably in January, up 8.3% m/m or N$2.63 billion to a total of N$34.4 billion. The BoN ascribed the increase to SACU receipts during the month.

Outlook

Overall, PSCE growth remains extremely subdued and was very much in line with the growth seen in December on a year-on-year basis, increasing by 1.5%. Rolling 12-month issuance is down 77.0% y/y to N$1.56 billion as at the end of January, with individuals taking up most (92.6%) of the credit extended over the past 12 months.

We expect the Bank of Namibia’s MPC to keep interest rates at its current level for the most part of the year, with the South African FRA curve pricing in the possibility of a 25 bp hike towards the end of the year. Although inflation and other market conditions will likely inform the MPC’s decision. Further rate cuts are likely to have very little, if any, impact on PSCE growth, as rates are already at historically low levels. Significant PSCE growth is likely to only return once economic conditions improve meaningfully.

NCPI – January 2021

The Namibian annual inflation rate ticked up to 2.7% y/y in January, following the 2.4% y/y increase in prices recorded in December. Prices in the overall NCPI basket increased by 0.9% m/m. On a year-on-year basis, overall prices in nine of the twelve basket categories rose at a quicker rate in January than in December, while the other three recorded slower rates of inflation. Prices for goods increased by 3.2% y/y while prices for services increased by 2.0% y/y.

Food & non-alcoholic beverages, the second largest basket item in weighting, accounted for 0.9 percentage points of the total inflation figure. Food and non-alcoholic beverage prices increased by 5.2% y/y, moderating from the 7.6% y/y recorded in December. Prices in twelve of the thirteen sub-categories recorded increases on an annual basis. The largest increases were observed in the prices of fruits which increased by 13.6% y/y and vegetables which increased by 12.4% y/y. The fish sub-category meanwhile saw a marginal price decrease of 0.3% y/y in January.

Alcoholic beverages and tobacco prices, making up approximately 12.6% of the overall inflation basket, was the second highest contributor to the annual inflation rate in January, with prices of the basket item increasing by 0.8% m/m and 5.0% y/y. The main driver in this basket category was tobacco prices which increased by 10.3% y/y while alcohol prices rose by 3.8% y/y.

The miscellaneous goods & services basket recorded inflation of 6.7% m/m and 6.5% y/y, and contributed 0.35 percentage points to the overall annual inflation figure. The financial services sub-category recorded a rather hefty price increase of 27.2% m/m and 24.0% y/y. The four other subcategories (personal care, personal effects, insurance and other services) all recorded quicker inflation on a month-on-month basis but recorded slower inflation on a year-on-year basis.

Despite the second consecutive uptick, the Namibian annual inflation rate continues to trend lower than that of neighbouring South Africa’s inflation rate. According to the NSA, the prices for the rental payments for dwellings sub-category rose by only 0.6% y/y in January. As rental payments make up a large portion (23.3%) of the CPI basket, the low inflationary adjustment means that Namibian annual inflation in 2021 is likely to remain well below Namibia’s long-run average. IJG’s inflation model forecasts an average inflation rate of 2.9% y/y in 2021 and 4.3% in 2022, indicating a steady increase in the inflation rate over the next two years. We remain of the view that the largest upside risk to this forecast is higher food costs and fuel prices.