Overall
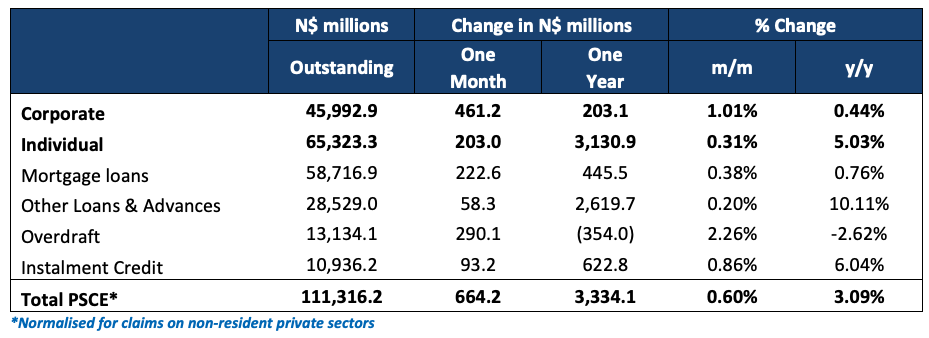
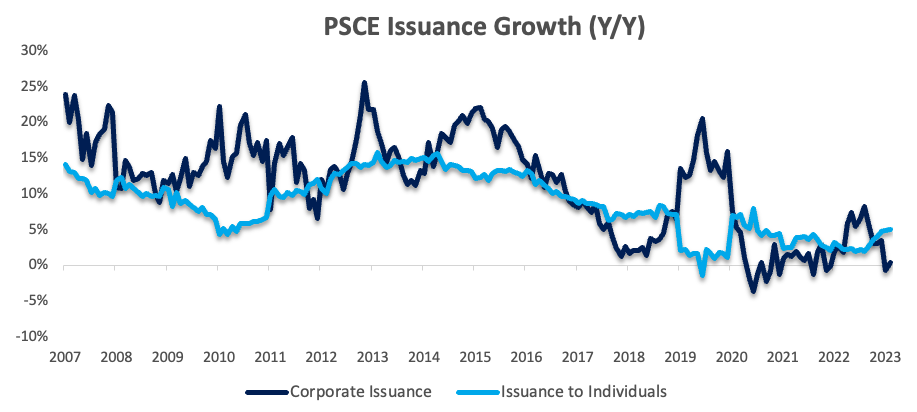
Private sector credit (PSCE) increased by N$664.2 million or 0.60% m/m in February, bringing the cumulative credit outstanding to N$111.3 billion on a normalised basis (removing the interbank swaps the Bank of Namibia (BoN) accounts for in non-resident private sector claims). Year-on-year PSCE growth stood at 3.1% in February, compared to a 2.6% y/y growth rate recorded in January. The past 12 months saw N$3.33 billion worth of credit extended to the private sector, a 40.1% increase from the N$2.38 billion issued over the same period a year ago. The cumulative 12-month period saw individuals taking up N$3.13 billion worth of credit, while corporates took up only N$203.1 million.
Credit Extension to Individuals
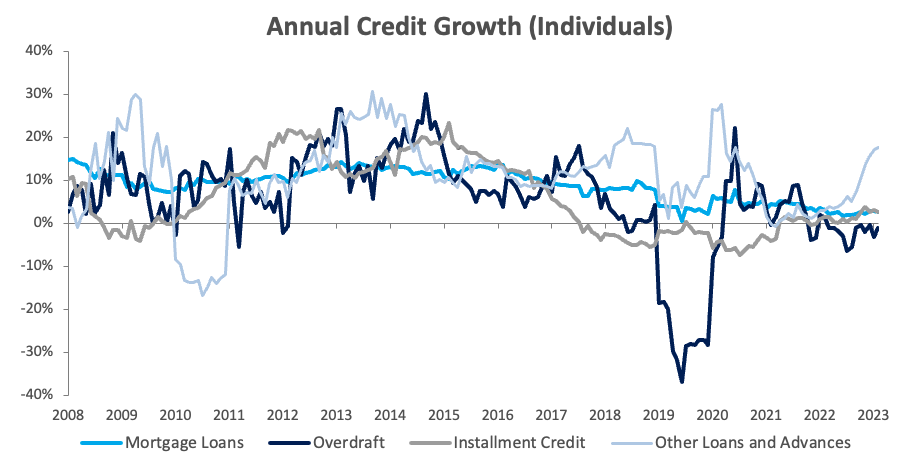
Credit extended to individuals increased by 0.3% m/m and 5.0% y/y, the quickest year-on-year growth since June 2020. All sub-categories registered growth on a month-on-month basis for a third consecutive month. Mortgage loans were the biggest driver of the month-on-month increase, posting growth of 0.2% m/m and 2.8% y/y. ‘Other loans and advances’ (which is made up of credit card debt and personal- and term loans) continues to post robust growth, growing by 0.5% m/m and 17.8% y/y in February. Overdraft facilities to individuals rose by 1.6% m/m but fell by 1.1% y/y.
Credit Extension to Corporates
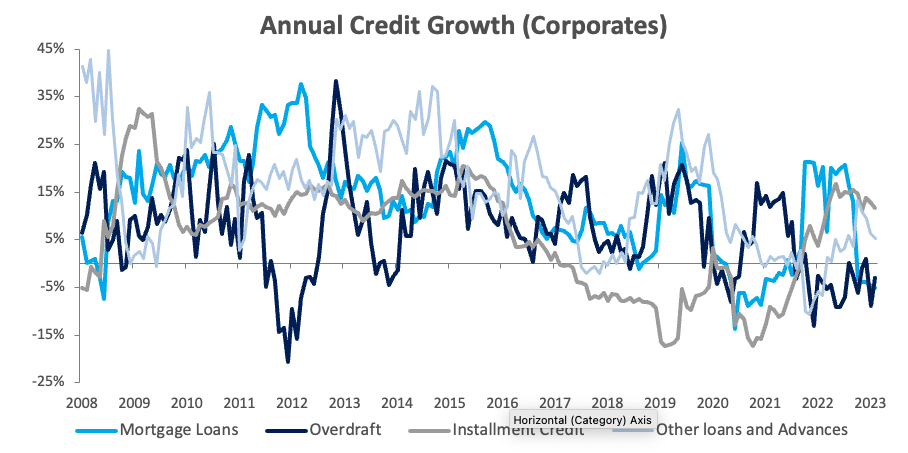
Credit extended to corporates increased by 1.0% m/m and 0.4% y/y. The primary growth driver in February was overdraft facilities to corporates which rose by 2.4% m/m but fell by 3.0% y/y. Mortgage loans climbed by 0.9% m/m but are down by 5.1% y/y, marking a fifth consecutive month of contraction on an annual basis. Instalment credit grew by 1.8% m/m and 11.6% y/y. Other loans and advances remained steady month-on-month but increased remains up by 5.3% y/y.
Banking Sector Liquidity
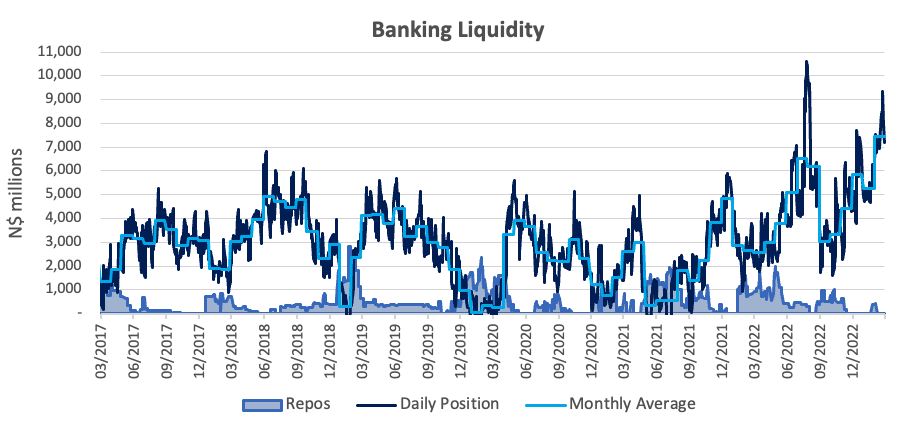
The overall liquidity position of the commercial banks strengthened considerably during February, rising by N$2.18 billion and ending the month at N$7.18 billion. The BoN ascribed the increase to pension fund liquidations, proceeds from diamond sales as well as increased government payments. The repo balance fell from N$419.0 million at the start of the month to zero at the end.
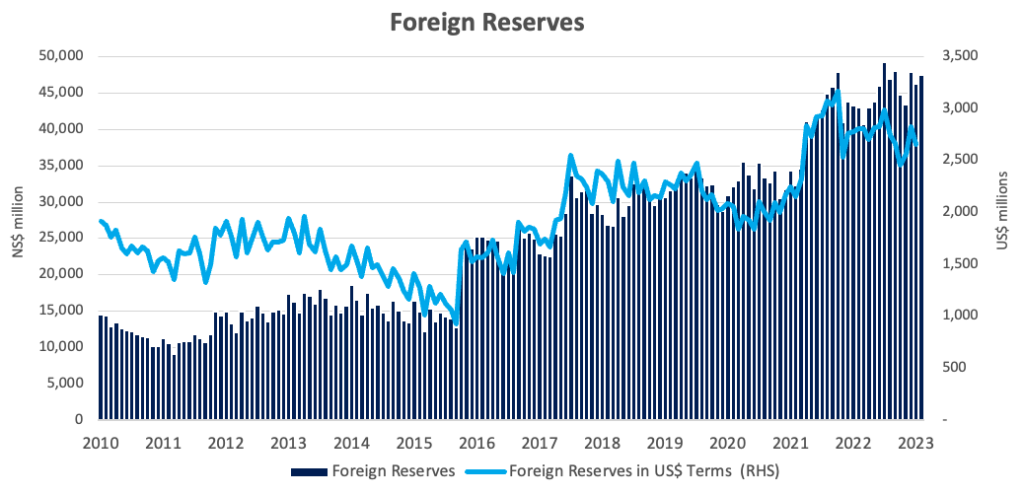
Money Supply and Reserves
According to the BoN’s latest monetary statistics, broad money supply (M2) rose by N$2.67 billion or 2.1% y/y in February. The central bank’s stock of international reserves rose by 2.7% m/m or N$1.25 billion to N$47.5 billion. The BoN noted that the increase was due to “revaluation adjustments” and commercial bank inflows during the month.
Outlook
PSCE growth ticked up slightly on both a monthly and annual basis in February. The monthly growth was primarily driven by increased corporate credit uptake, particularly from overdraft facilities. Credit uptake by individuals recorded notable growth as well on the back of a N$91.8 million month-on-month increase in mortgage loans. While the uptick in the year-on-year growth rate is positive, it has been trending well below inflation since May 2020, meaning that we have not seen positive PSCE growth in real terms for two-and-a-half years now.
As we have highlighted in last month’s report, credit uptake by corporates has been particularly lacklustre since June last year, with only short-term ‘other loans and advances’ and instalment credit exhibiting positive growth on an annual basis.