Overall
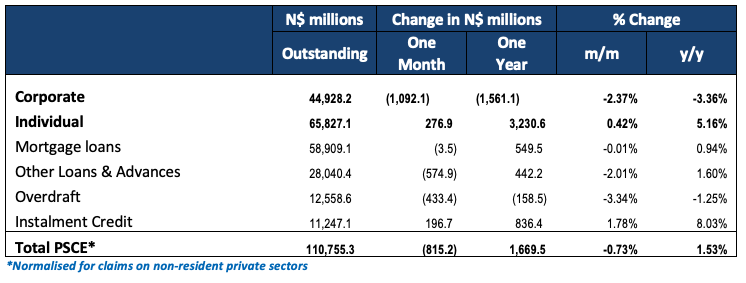
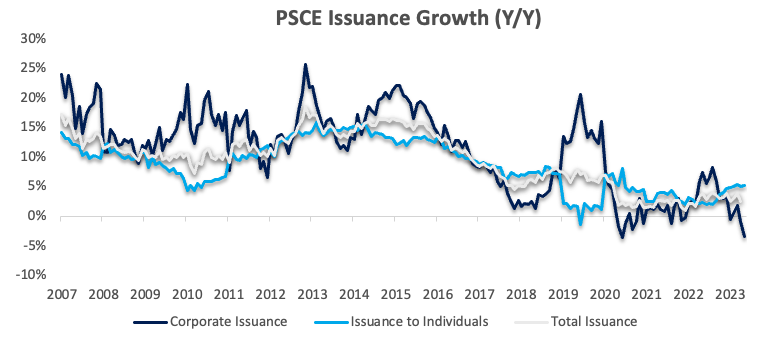
Private sector credit (PSCE) fell by N$815.2 million or 0.73% m/m in May, bringing the cumulative credit outstanding to N$110.8 billion on a normalised basis (removing the interbank swaps the Bank of Namibia (BoN) accounts for in non-resident private sector claims). Annual PSCE growth slowed to 1.53% in May from 2.57% in April. N$1.67 billion worth of credit was extended to the private sector over the past twelve months, 59.0% less than the N$4.08 billion issued over the same period a year ago. Individuals took up N$3.23 billion worth of credit over this period, while corporates deleveraged by N$1.56 billion.
Credit Extension to Individuals
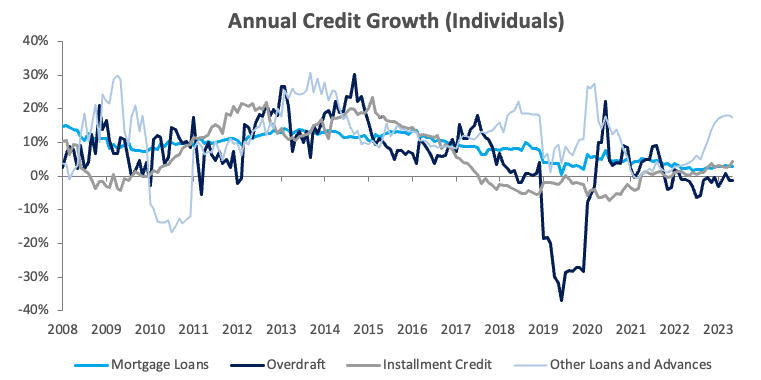
Credit extended to individuals rose by 0.4% m/m and 5.16% y/y. As was the case in April, all sub-categories, bar overdrafts, posted growth on a year-on-year basis. Mortgage loans attributed to most of the credit uptake by individuals during the month, with the sub-category recording growth of 0.2% m/m and 2.8% y/y. Instalment credit extended to individuals increased by 1.6% m/m and 4.4% y/y in May. ‘Other loans and advances’, which is made up of credit card debt and personal- and term loans, grew by 0.5% m/m and 17.5% y/y, while overdraft facilities to individuals increased by 0.3% m/m but fell 1.3% y/y.
Credit Extension to Corporates
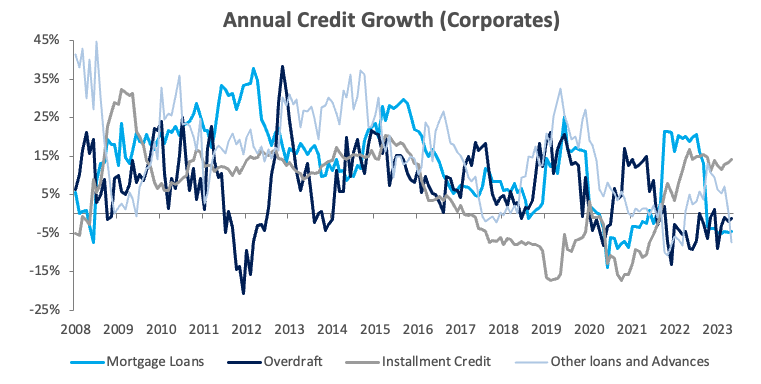
The month-on-month PSCE contraction was primarily due to corporates deleveraging their balance sheets. Credit extension to corporates fell by 2.4% m/m and 3.4% y/y as all sub-categories, bar instalment credit, fell on both a month-on-month and year-on-year basis. ‘Other loans and advances’ declined by 3.7% m/m and 7.5% y/y. Overdraft facilities to corporates contracted by 4.2% m/m and 1.2% y/y, while mortgage loans fell by 0.8% m/m and 4.5% y/y. Instalment credit to corporates rose by 2.1% m/m and 14.1% y/y.
Banking Sector Liquidity
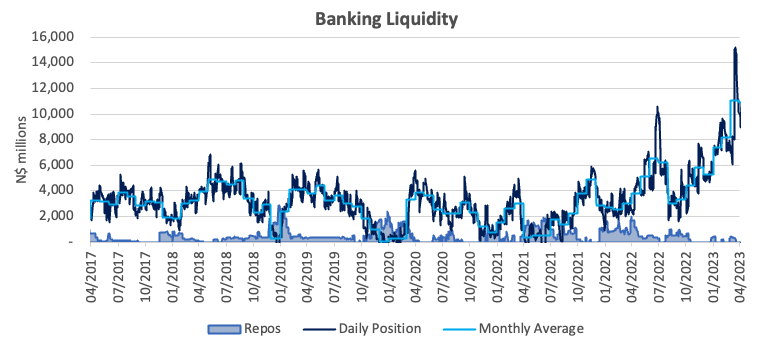
The overall liquidity position of the commercial banks remained strong during May, declining by N$150.9 million to an average of N$10.9 billion. According to the Bank of Namibia (BoN) the small decline was due to corporates gearing up for corporate tax payments and partial outflows of funds received from the Heineken-Namibia Breweries transactions. The repo balance was unsurprisingly near zero for most of the month.
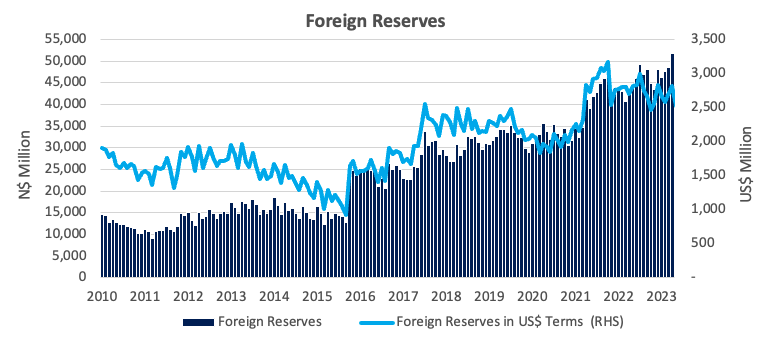
Money Supply and Reserves
According to the BoN’s latest monetary statistics, broad money supply (M2) rose by N$9.83 billion or 7.7% y/y in May. The stock of international reserves fell by 4.0% m/m or N$2.07 billion to N$49.7 billion, translating to 5.2 months of import cover. The BoN ascribed the decline to net commercial bank outflows due to “portfolio investment and import payments”.
Outlook
The annual PSCE growth rate slowed to the lowest level since December 2021 in May. As mentioned earlier in the report, the growth slowdown, and month-on-month contraction, was primarily due to corporates continuing to delever their balance sheets, amid rising interest rates. Credit extension to individuals is stronger, by comparison, but continues to trend well below inflation. While central bank rhetoric in both Namibia and South Africa remains hawkish, we do not anticipate overall PSCE growth to pick up materially in the short- to medium term.