Twitter Timeline
[custom-twitter-feeds]
Categories
- Calculators (1)
- Company Research (295)
- Capricorn Investment Group (51)
- FirstRand Namibia (53)
- Letshego Holdings Namibia (25)
- Mobile Telecommunications Limited (7)
- NamAsset (3)
- Namibia Breweries (45)
- Oryx Properties (58)
- Paratus Namibia Holdings (6)
- SBN Holdings Limited (17)
- Economic Research (657)
- BoN MPC Meetings (12)
- Budget (19)
- Building Plans (141)
- Inflation (142)
- Other (28)
- Outlook (17)
- Presentations (2)
- Private Sector Credit Extension (140)
- Tourism (7)
- Trade Statistics (4)
- Vehicle Sales (143)
- Media (25)
- Print Media (15)
- TV Interviews (9)
- Regular Research (1,788)
- Business Climate Monitor (75)
- IJG Daily (1,591)
- IJG Elephant Book (12)
- IJG Monthly (108)
- Team Commentary (250)
- Danie van Wyk (61)
- Dylan van Wyk (27)
- Eric van Zyl (16)
- Hugo van den Heever (1)
- Leon Maloney (11)
- Top of Mind (4)
- Zane Feris (12)
- Uncategorized (6)
- Valuation (4,446)
- Asset Performance (115)
- IJG All Bond Index (2,059)
- IJG Daily Valuation (1,789)
- Weekly Yield Curve (482)
Meta
Category Archives: Economic Research
Building Plans – January 2023
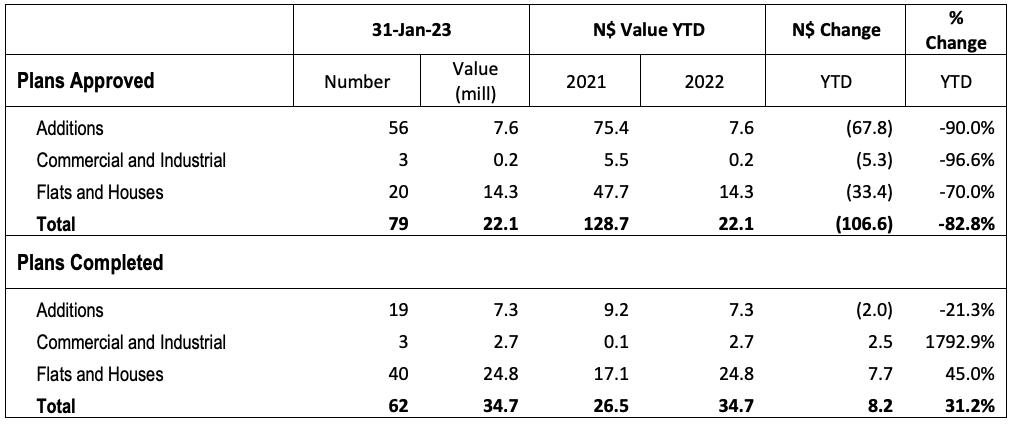
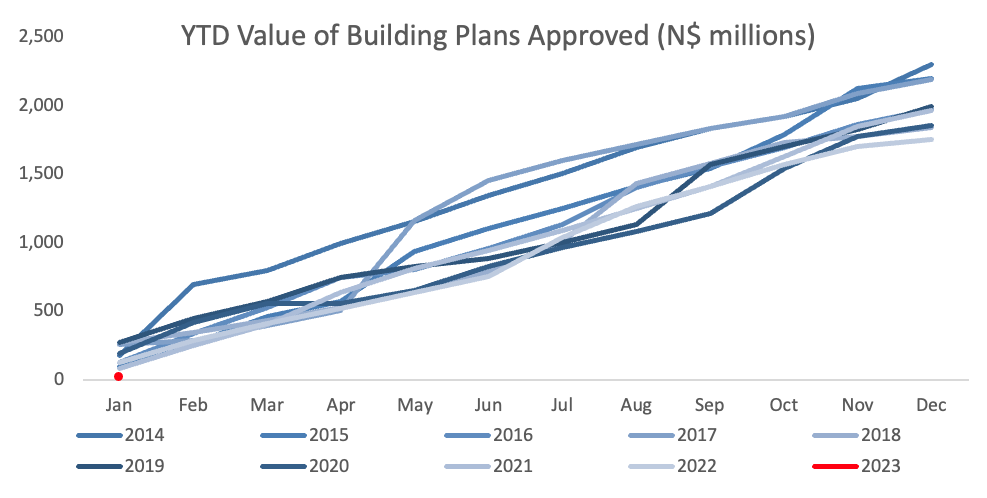
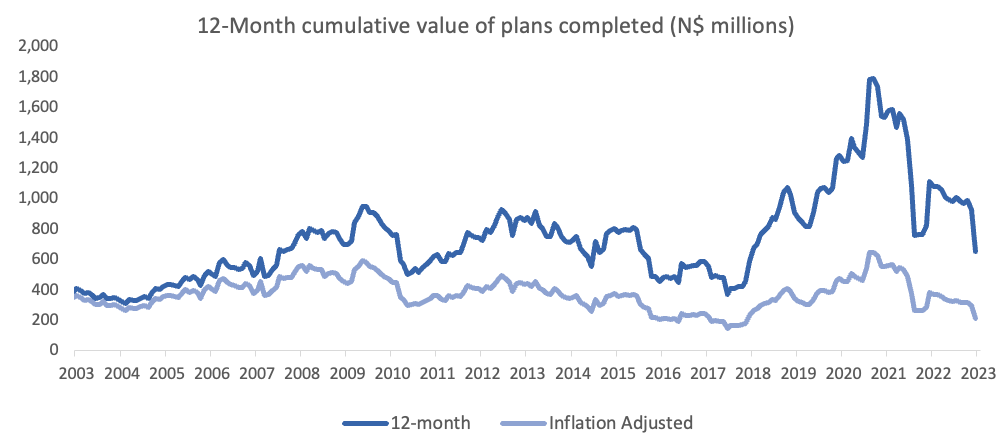
A total of 79 building plans were approved by the City of Windhoek in January, a 28.2% m/m decline from the 110 approved in December. Bar April 2020, which recorded no approvals due to the Covid-19 lockdowns, January’s total number of approvals was the lowest since February 2017. In monetary terms, the approvals were valued at N$22.09 million, the lowest since April 2000, excluding April 2020. On a twelve-month cumulative basis, 2,370 building plans worth approximately N$1.65 billion were approved, representing a decline over the prior 12-month period both in number and value terms of 5.4% y/y and 17.9% y/y, respectively. 62 building plans valued at N$34.7 million were completed during the month.
In number terms, additions to properties made up the largest portion of approvals. The month of January saw 56 additions to properties worth N$7.6 million getting the nod. A decline of 32.5% m/m in number terms and 63.9% m/m in value terms. In comparison to January 2022, the number of additions to properties in January of this year has decreased by 43.4%, with a corresponding decrease in value of 90.0%. On a 12-month cumulative basis, the number of additions to properties has been hovering around the 1,600 mark since 2018. 19 Additions worth N$7.3 million were completed during the month.
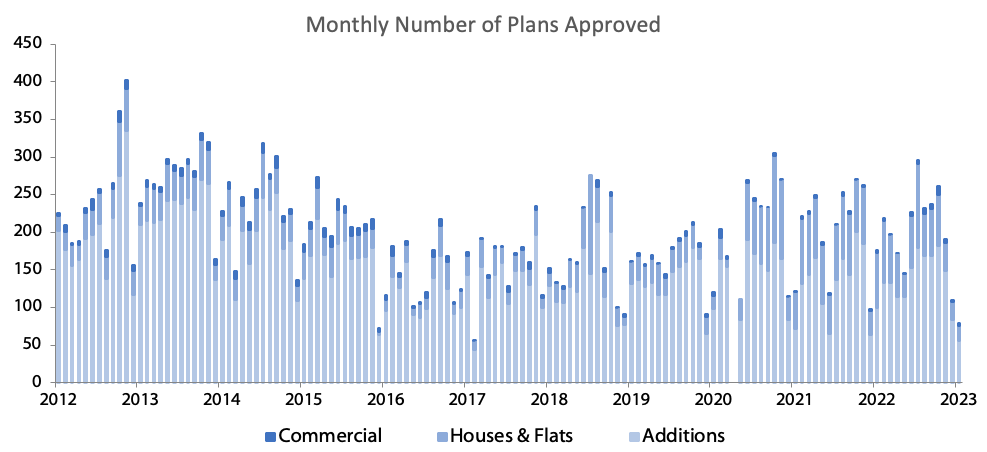
Only 20 new residential units valued at N$14.3 million were approved in January, which is four fewer than in December, and represents a decline of 73.0% y/y in number of units approved and a 70.0% y/y drop in value terms. To put into perspective just how low January’s new residential approvals were, in 2020, when the Covid-19 lockdowns hampered construction activity, 53 new residential units worth N$68.6 million were approved on average each month. That being said, January is not necessarily a proxy for the annual residential approval numbers, as recent historical data suggests, and we may very well still see an improvement in these numbers going forward. A total of 40 residential units worth N$24.8 million were completed during the month.
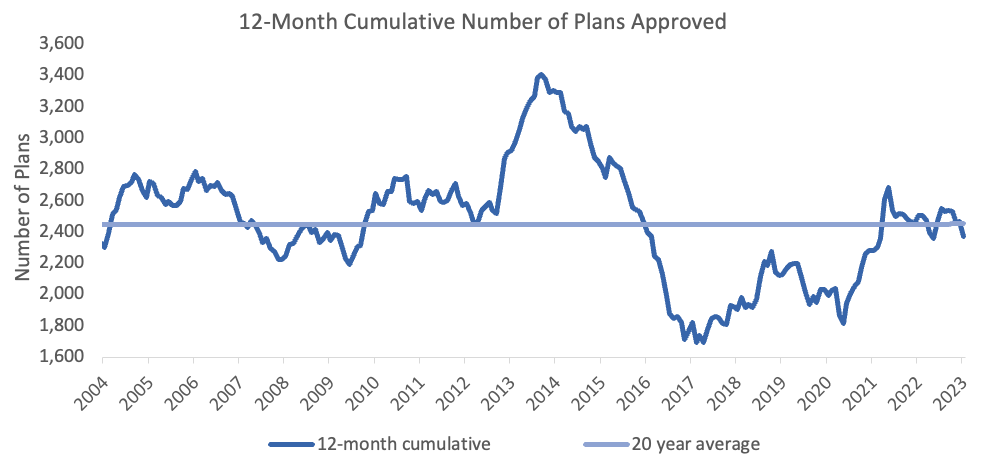
3 new commercial and industrial units, worth just N$190,000, were approved in January. This compares to the same number of plans valued at N$4.00 million in December and N$5.53 million in January 2022. On average over the last 20 years, 5 commercial units valued at N$26.7 million were approved in the first month of the year. On a rolling 12-month basis, the number of approvals for this category rose to 57 units worth N$157.5 million as at January, compared to the 39 approved units worth N$169.9 million over the corresponding period a year ago. 3 Commercial units valued at N$2.65 million were completed in January.
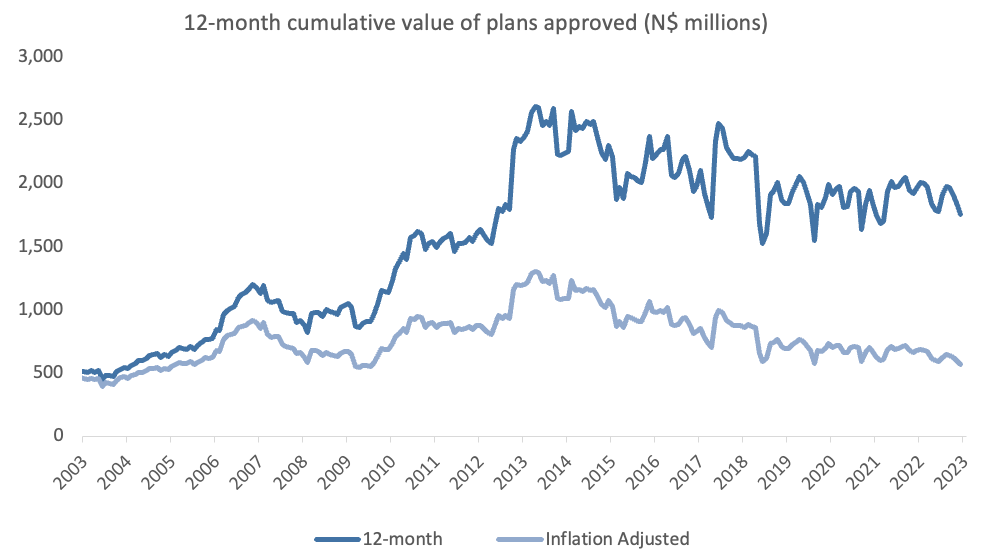
In terms of number of building plan approvals in the capital, 2023 is off to the slowest start since 1990, while the value of the total approvals was the lowest for the first month of the year since 2000, even before adjusting for inflation. Building plans approved is a leading indicator of economic activity in the country and the above data implies that certain sectors of the Namibian economy are still showing signs of hardship.
Notably, the value of new walls approved during the month (which we exclude from our data) was more than five times the value of new commercial and industrial building plans approved. This shows that most businesses do not have immediate plans to expand their existing operations.
There is a possibility that construction activity may increase during the year. However, considering the overall trend of the 12-month cumulative value of approvals over the past couple of years, as illustrated in the graph above, any growth, if at all, will be from an already low base that has been on a declining trend.
NCPI January 2023
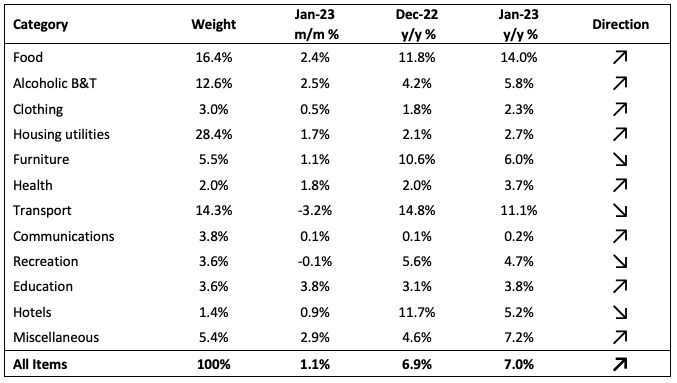
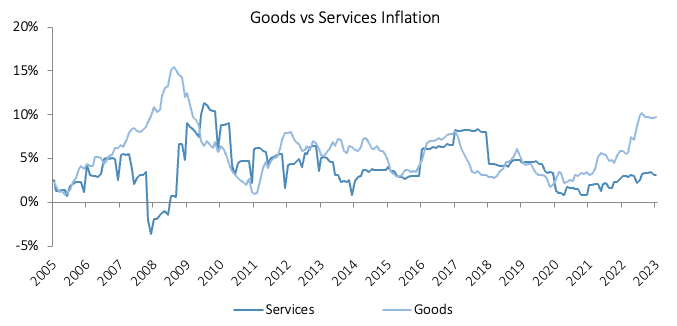
The Namibian annual inflation rate rose to 7.0% y/y in January on the back of the 6.9% y/y increase in prices recorded in December. On a monthly basis, prices in the overall NCPI basket rose by 1.1%, compared to a 0.3% m/m increase in December. On a year-on-year basis, overall prices in eight of the twelve basket categories rose at a quicker rate in January than in December, while the other four recorded slower rates of inflation. Prices for goods increased by 9.8% y/y while prices for services rose by 3.1% y/y.
Inflation Attribution
Food and non-alcoholic beverages prices rose 14.0% in January from a year earlier. The basket category, accounting for 16.4% of the NCPI basket , contributed 2.6 percentage points to the annual inflation rate in January. This marks the first month since August 2021 that the transport category was not the top contributor to the annual inflation rate. Month-on-month food and non-alcoholic prices rose by 2.4%, the highest since March 2016. Fruit price inflation ticked up for a second consecutive month to 22.3% y/y, with citrus prices rising by 23.8% y/y, grapes by 6.7% y/y and avocados logging 64.2% y/y. The prices of breads and cereals rose by 3.0% m/m and 22.3% y/y, emanating from maize prices that are 37.2% higher than a year ago, and bread- and cake flour being 27.1% more expensive. The only sub-category to record slower inflation on an annual basis than last month was ‘oils and fats’ which posted inflation of 16.8% y/y, the lowest since March 2022.
Transport was the second largest contributor to January’s annual inflation print, contributing 1.64 percentage points. Prices in this category rose by 11.1% y/y, the lowest since October 2021. On a month-on-month basis, transport prices fell by 3.2%, following the Ministry of Mines and Energy’s decision to lower the prices of both petrol and diesel in the beginning of January. This resulted in the operation of personal transport equipment inflation slowing to 15.9% y/y from the 22.6% recorded in December. The Ministry’s decision in the beginning of February to leave fuel prices unchanged should aid to further ease price pressure in this category. Prices of the purchase of vehicles sub-category ticked up for a fourth consecutive month to 1.3% m/m and 6.2% y/y. Public transportation services inflation remained relatively steady month-on-month and eased to 0.9% y/y from 1.4% in December.
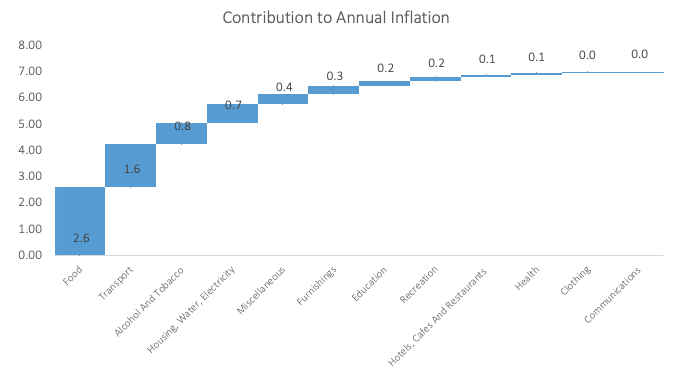
The alcohol and tobacco category posted inflation of 2.5% m/m and 5.8% y/y. The prices of alcoholic beverages climbed by 3.0% m/m and 6.5% y/y. The acceleration from December’s 4.5% y/y rate was mainly driven by the prices of white spirits that are 24.7% higher than a year ago. Tobacco products recorded price increases of 0.2% m/m and 2.7% y/y, with cigarette prices up 5.3% y/y while pipe tobacco prices are down 4.2% y/y.
Outlook
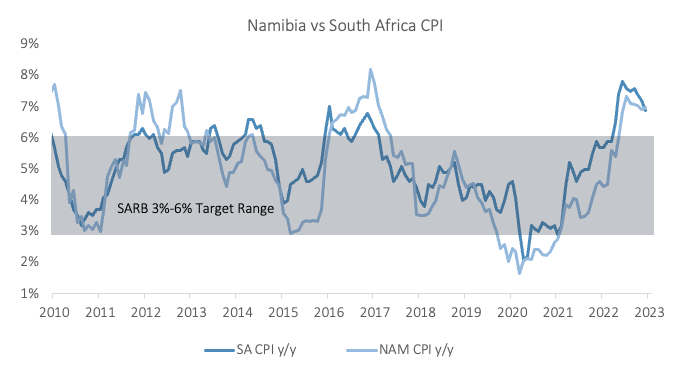
Namibia’s annual inflation rate of 7.0% in January came in moderately higher than South Africa’s rate of 6.9%, for the first time since April 2019. Lower fuel prices helped to tame inflationary pressure, but stubbornly high food inflation (the highest since March 2009 on an annual basis) continued to put upward pressure on the overall inflation print.
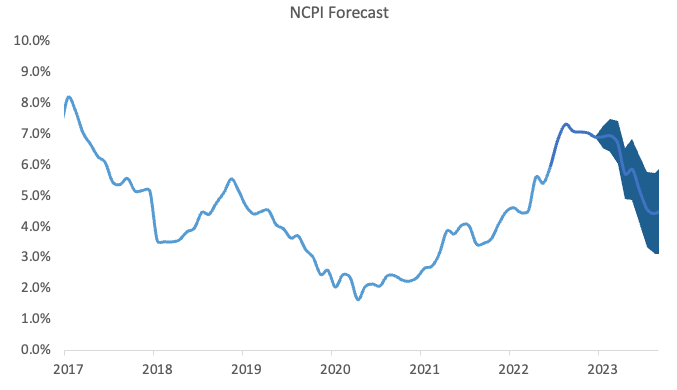
While the housing, water & electricity category’s contribution to the annual rate, at 0.7 percentage points, was relatively low, it is worth noting that the prices for the rental payments for dwellings subcategory rose by 2.1% y/y from 1.4% y/y previously. As rental payments make up a large portion (23.3%) of the CPI basket, the low inflationary adjustment means that Namibia’s annual inflation is likely to moderate throughout the year, provided that transport inflation continues to slow. IJG’s inflation model currently forecasts Namibia’s annual inflation rate to steadily slow during the course of 2023, before reaching around 4.3% at the end of the year.
The Bank of Namibia (BoN) in its monetary policy committee today (15 February 2023) raised the repo rate by a further 25bps to 7.00%, in line with the SARB’s hike in January. Forward-rate agreements, which are used to speculate on future borrowing costs, show traders are pricing in one more 25 basis-point increase by the SARB in the current rate-hiking cycle. Should the BoN follow suit, it will take the Namibian repo rate to 7.25%, the highest since May 2009.
