Overall
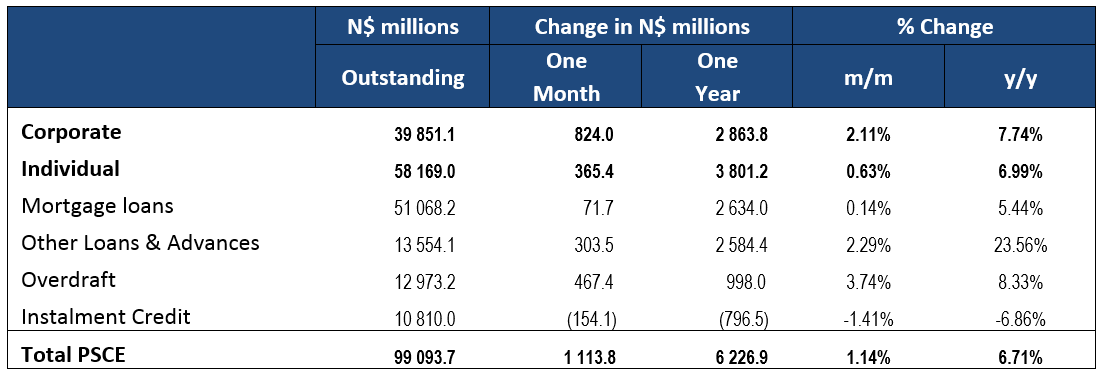
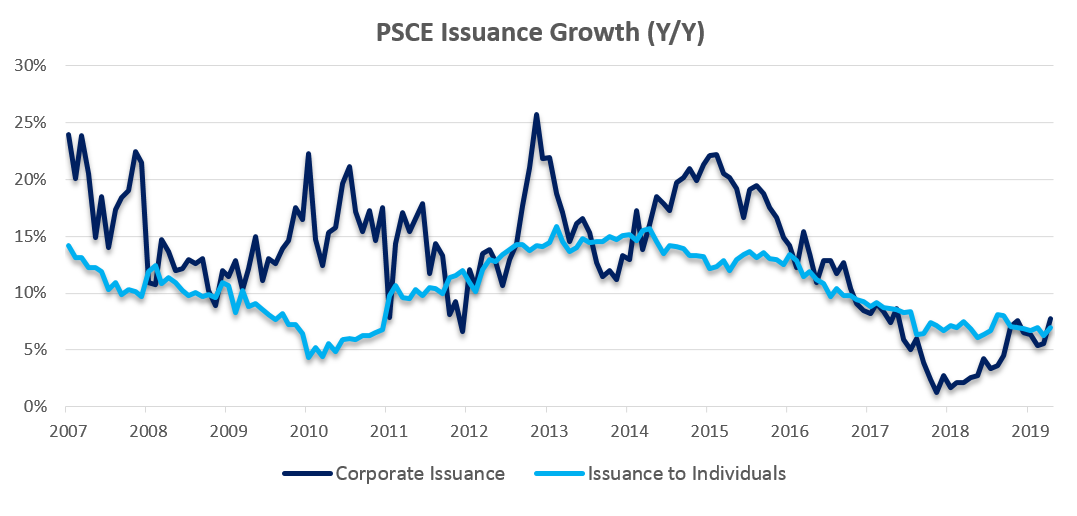
Total credit extended to the private sector (PSCE) increased by N$1.11 billion or 1.14% m/m in April, bringing the cumulative credit outstanding to N$99.1 billion. On a year-on-year basis, private sector credit extension grew by 6.71% in April, compared to 5.79% recorded in March. On a rolling 12-month basis, N$6.22 billion worth of credit was extended. N$2.86 billion worth of credit has been extended to corporates and N$3.80 billion to individuals on a 12-month cumulative basis, while the non-resident private sector has decreased their borrowings by N$199.1 million.
Credit Extension to Individuals
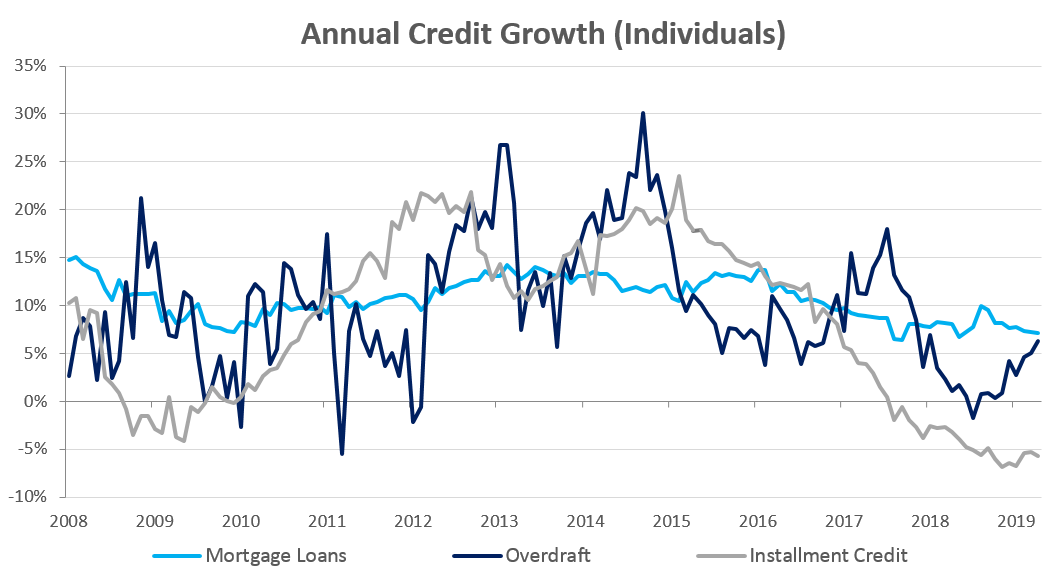
Credit extended to individuals increased by 7.0% y/y in April, an acceleration from the 6.3% y/y growth recorded in March. Most of the growth stems from an increase in shorter-dated debt, with overdraft facilities to individuals increasing by 0.9% m/m and 6.3% y/y. Other loans and advances recorded growth of 2.0% m/m and 21.2% y/y, while installment credit remained depressed, contracting by 1.2% m/m and 5.7% y/y. Mortgage loans to individuals grew by 0.4% m/m and 7.1% y/y.
Credit Extension to Corporates
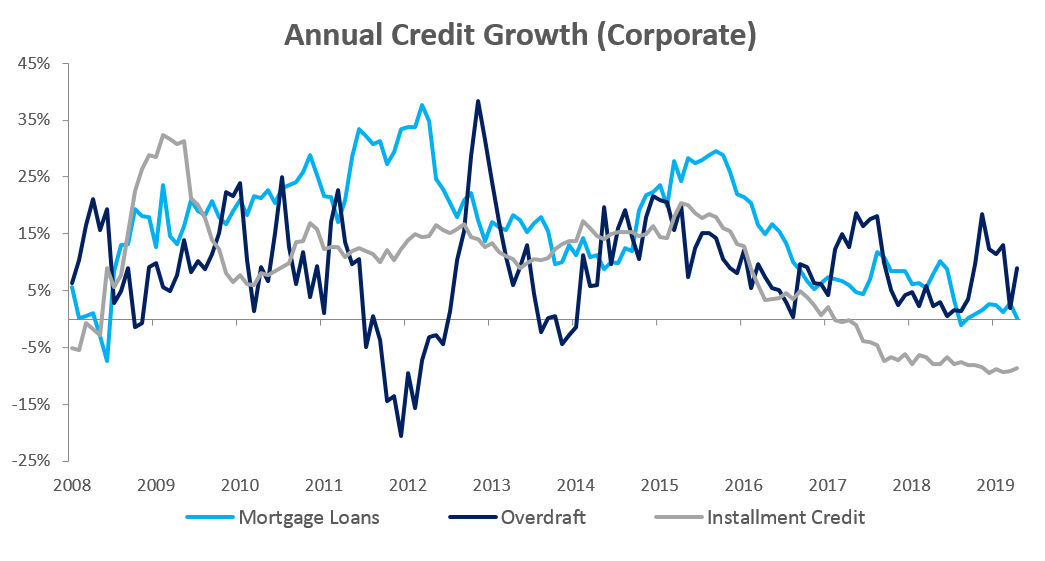
Credit extension to corporates grew by 2.1% m/m and 7.7% y/y in April. On a rolling 12-month basis, N$2.86 billion was extended to corporates as at the end of April compared to N$2.05 billion as at the end of March. The month-on-month increase was mostly driven by corporates making use of short-term credit facilities, in particular overdrafts, which increased by 4.7% m/m and 9.0% y/y. Other loans and advances, which consists of credit card debt, personal and term loans, extended to businesses increased by 4.7% m/m and 26.2% y/y. Mortgage loans extended to corporates contracted by 0.8% m/m, but increased by a low 0.1% y/y.
Banking Sector Liquidity
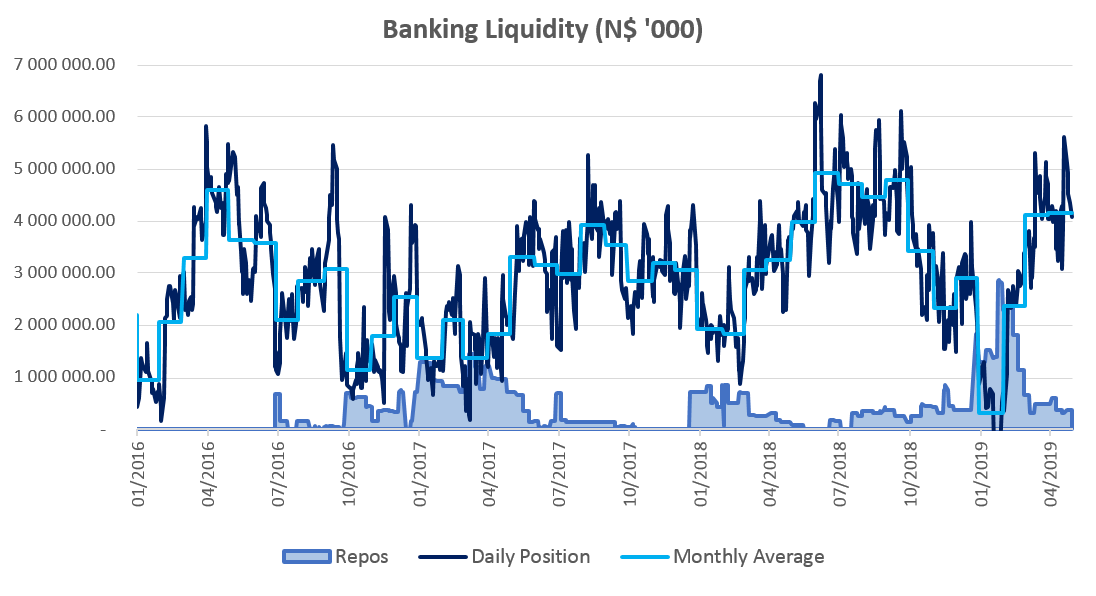
The overall liquidity position of commercial banks increased by N$31.4 million to an average of N$4.15 billion during April from N$4.11 billion in March. According to the Bank of Namibia (BoN), the increase is attributable to SACU receipts, coupled with increased mineral proceeds during the period under review. The improved liquidity resulted in a further decrease in use of the BoN’s repo facility by commercial banks, with the outstanding balance of repo’s decreasing from N$479.3 million at the start of April to N$385.7 million by month end.
Reserves and Money Supply
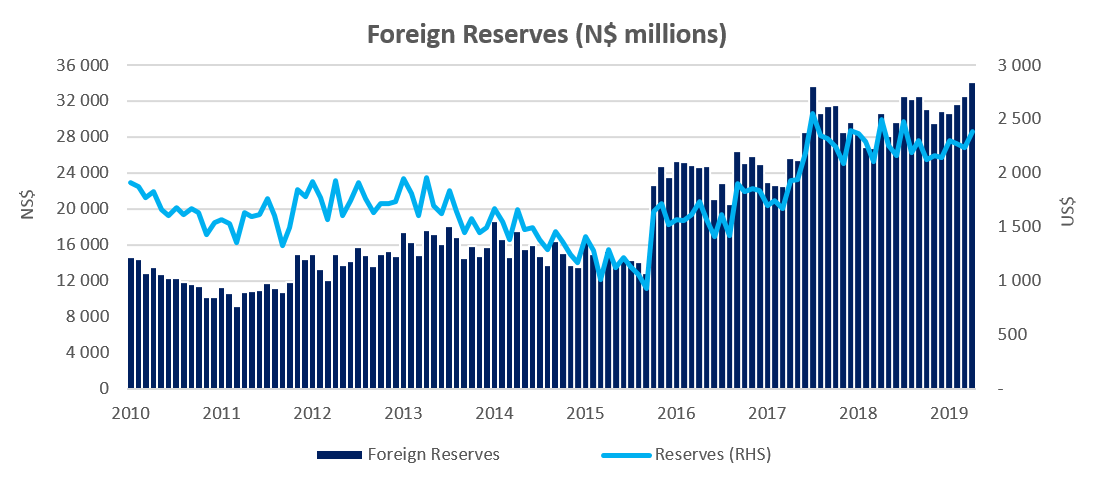
Broad money supply rose by N$9.91 billion or 10.2% y/y in April following a 6.9% y/y increase in March, as per the BoN’s latest money statistics release. Foreign reserve balances rose by 4.9% m/m to an all-time-high of N$34.2 billion in April. The BoN stated that the increase is largely due to the increase in the SACU receipts.
Outlook
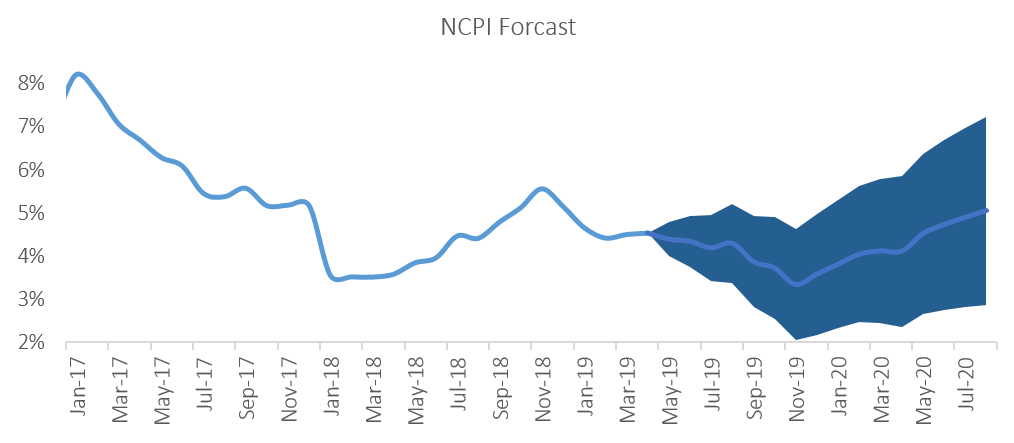
Private sector credit extension growth remained depressed at the end of April, increasing by 6.7% y/y. From a 12-month rolling perspective, credit issuance is up 13.1% from the N$5.51 billion issuance observed at the end of April 2018, with individuals taking up most (61.0%) of the credit extended over the past 12 months. Most of the growth in PSCE for April stemmed from shorter-dated debt. Our expectation is for private sector credit extension to remain under pressure as both consumer and business confidence remains low.
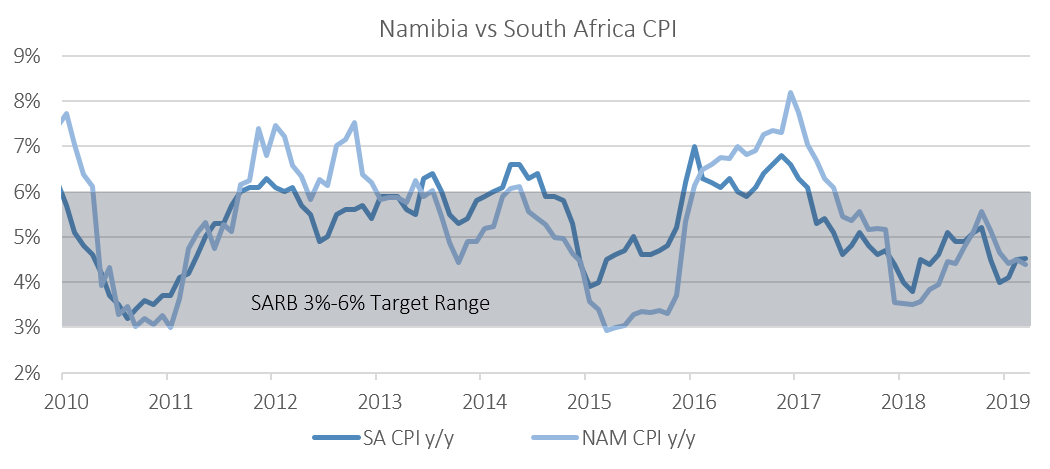
We expect the BoN to follow the SARB’s MPC decision to leave the Repo rate unchanged at its next MPC meeting later this month. Interest rates, however, remain accommodative and further rate cuts are unlikely to result in a meaningful increase in the uptake of credit.

