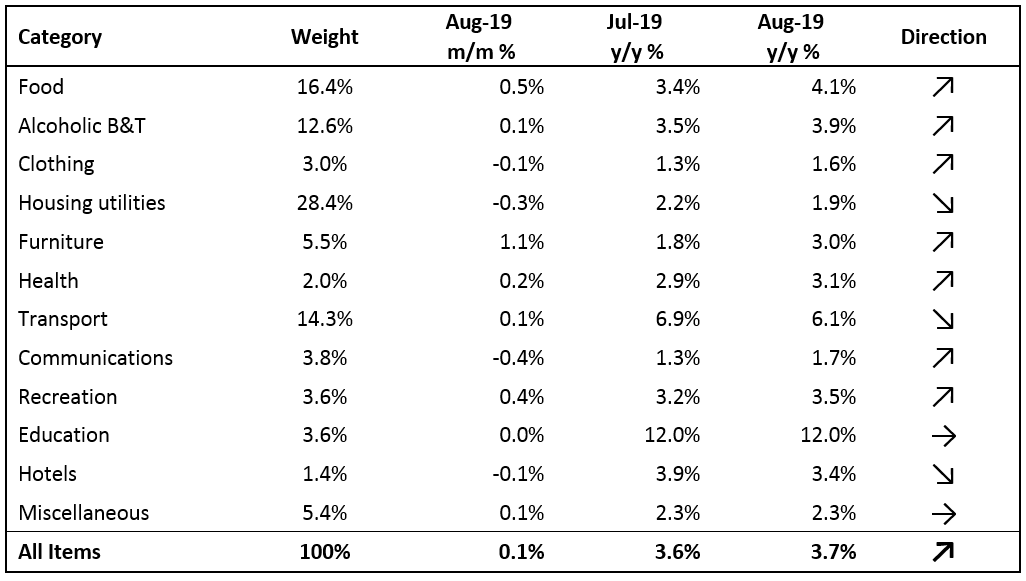
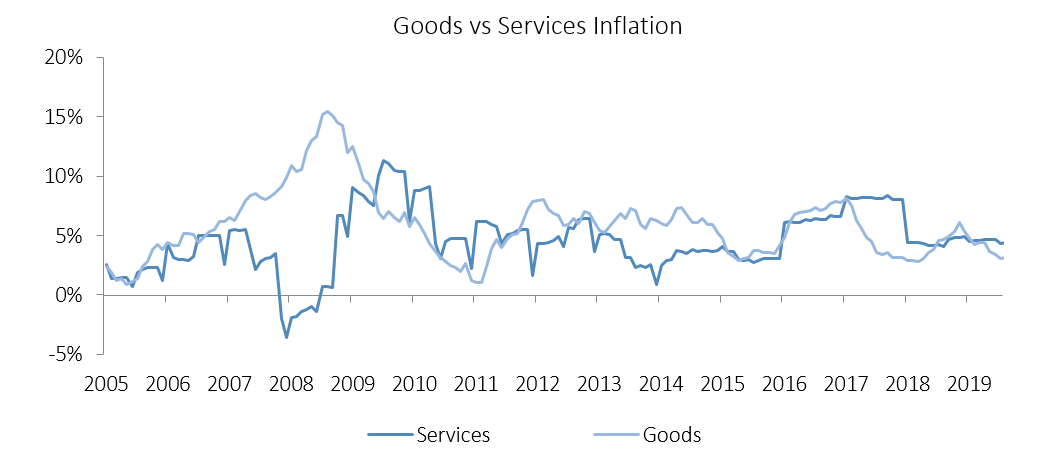
The Namibian annual inflation rate increased marginally to 3.7% y/y in August, following the 3.6% y/y increase in prices recorded in July. On a month-on-month basis, prices rose 0.1% following a 0.2% price change recorded in July. On an annual basis, prices in seven of the twelve basket categories rose at a quicker rate in August than in July, this was offset by slower rates of inflation in three categories, while the rate of inflation in two categories remained unchanged. Prices for goods rose by 3.2% y/y while prices for services increased by 4.4% y/y.
As in July, Transport was the largest contributor to annual inflation in August, accounting for 0.8% of the total 3.7% inflation figure. Transport prices increased by 0.1% m/m and 6.1% y/y in August, slightly slower than the 0.5% m/m and 6.9% y/y increase recorded in July. Prices in the three subcategories all recorded increases on a year-on-year basis. The public transportation services subcategory registered an increase of 19.9% y/y as a result of the 20% increase in taxi fares that was approved in August 2018. Prices relating to the purchase of vehicles increased at a rate of 3.0% y/y, while prices relating to the operation of personal transport equipment increased by 3.8% y/y.
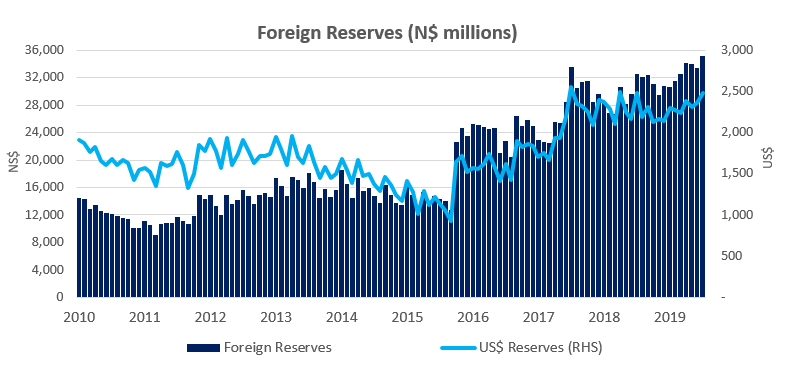
The ongoing trade dispute between China and the US, coupled with tensions in the Persian Gulf continues to pressure on the price of Brent Crude oil, resulting in a month-on-month decrease of 7.3% to US$60.47 at the end of August. The lower oil price should bode well for a cut in Namibian pump prices in the coming months if oil prices remain around current levels, and if the rand continues appreciating against the US dollar.
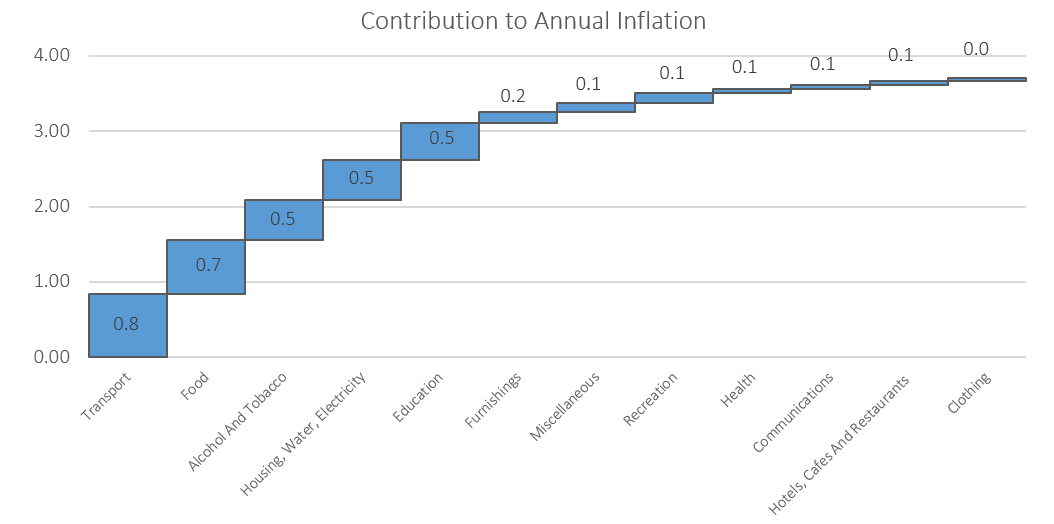
Food & non-alcoholic beverages, the second largest basket item in weighting, was the second largest contributor to annual inflation, accounting for 0.7% of the total inflation figure. Food and non-alcoholic beverage prices increased by 4.1% y/y, ticking up from the 3.4% y/y recorded in July. Prices in eleven of the thirteen sub-categories recorded increases on annual basis. The largest increases were observed in the prices of vegetables which increased by 13.9% y/y and fruits which increased by 11.0% y/y. The meat and oils and fats sub-categories saw marginal price decreases of 0.7% y/y and 0.4% y/y, respectively. The decline in meat prices is not expected to last however, as it is largely driven by high supply of animals as farmers slaughter more during the drought. Restocking farms in the future will likely lead to upward pressure on meat prices.
The alcohol and tobacco category displayed an increase of 0.1 m/m and 3.9% y/y in August. The main driver in this basket category remains alcohol prices which prices which increased by 6.0% y/y while tobacco prices were down 5.1% y/y. A 7.8% m/m decrease in tobacco prices recorded in May is the cause for annual decrease in tobacco prices. The Namibia Statistics Agency (NSA) has not provided any explanation for this decrease in any of its bulletins since May.
The NSA generally reconstitutes the CPI basket every five years, with the last reconstitution done in 2013. The NSA states in its bulletin that it planned to rebase the CPI basket this year based on the 2015/16 Namibia Household Income and Expenditure Survey (NHIES) results. There were however methodological changes in the NHIES 2015/16 and as a result the rebasing could not take place. According to the NSA, the next CPI rebasing will take place after the next NHIES. The NSA notes that that the next CPI rebasing will only be done after the next NHIES has been conducted.
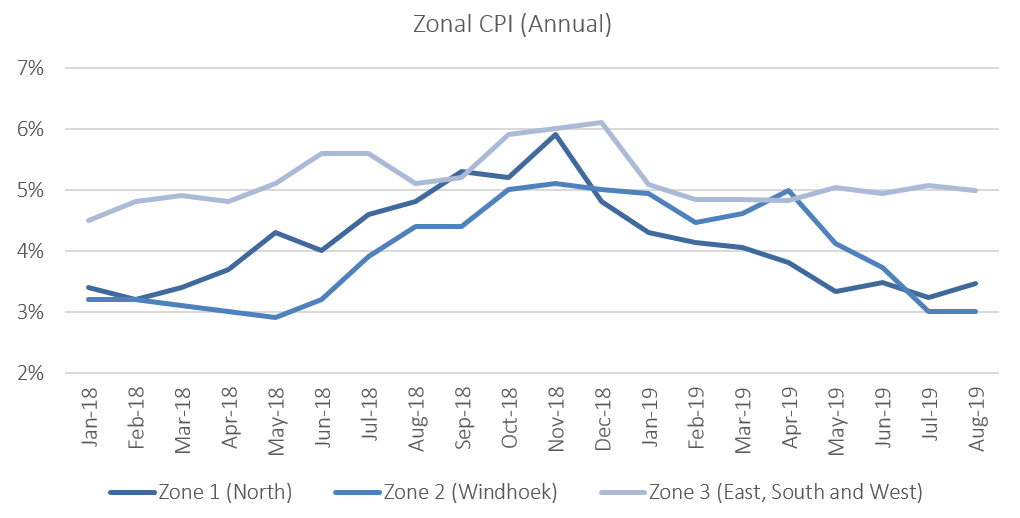
Zonal data shows that on a monthly basis, prices printed flat in the central zone, while rising elsewhere in the country. On an annual basis, the Windhoek and surrounding area, recorded the lowest inflation rate at 3.0% in August, with the mixed zone 3 covering the south, east and west of the country recording the highest rate of inflation at 5.0% y/y. Inflation in the northern region of the country increased to 3.5% y/y.
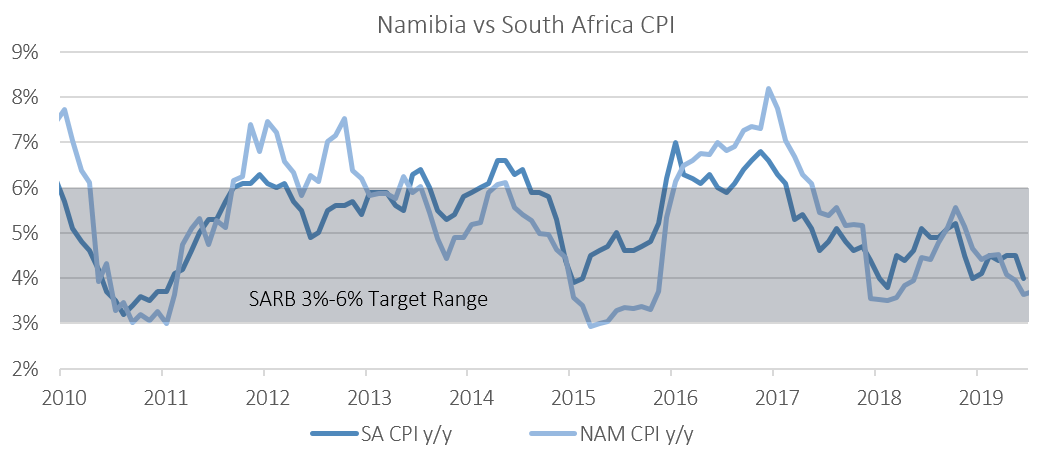
The Namibian annual inflation rate of 3.7% y/y for August continues to trend lower than that of neighbouring South Africa’s July inflation figure 4.0% y/y for a fourth consecutive month. Low food price inflation and subdued housing and related inflation rates have contributed greatly to the low overall inflation figure in August.
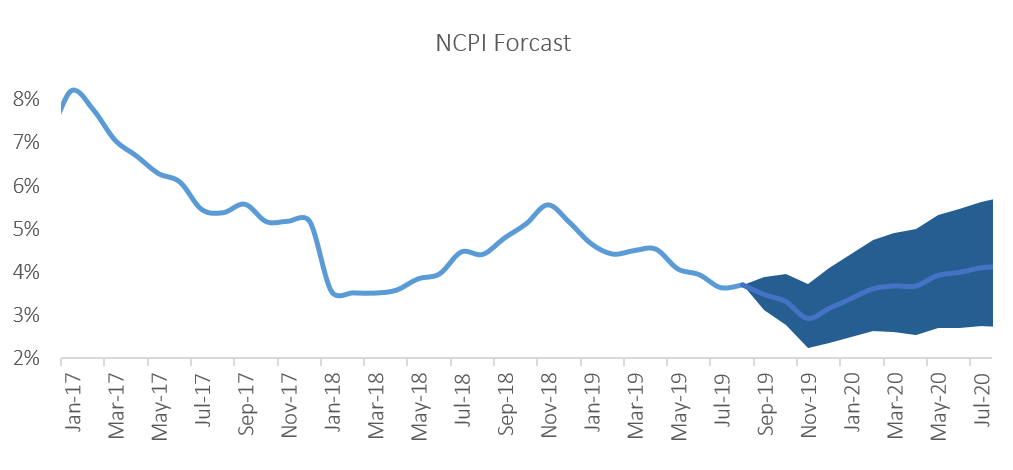
Should the price of oil continue to trend at current levels, coupled with the appreciation of the Namibian Dollar against the US dollar that we have seen in recent weeks, we expect the Ministry of Mines and Energy to cut fuel prices sometime in the coming months, which should ease transport inflation and bring some welcome relief to consumers. IJG’s inflation model forecasts an average inflation rate of 3.9% y/y in 2019. The largest upside risk to this forecast is higher food costs, as the drought affects local food production.