Building Plans – October 2018

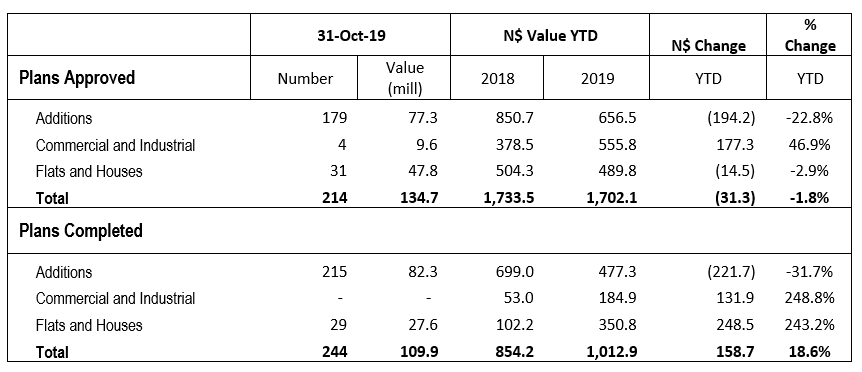
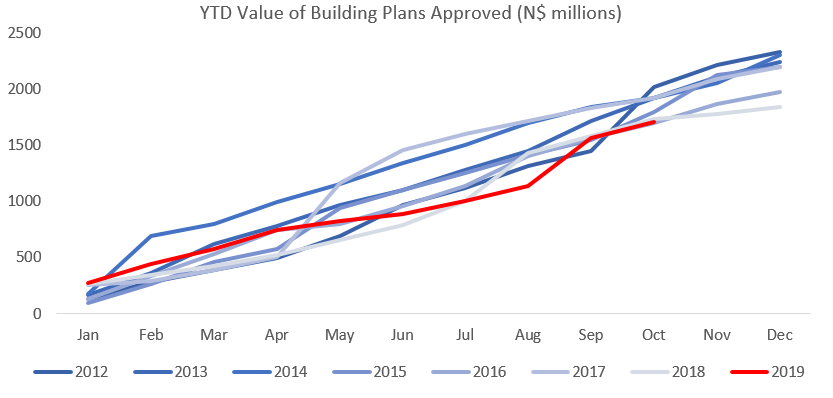
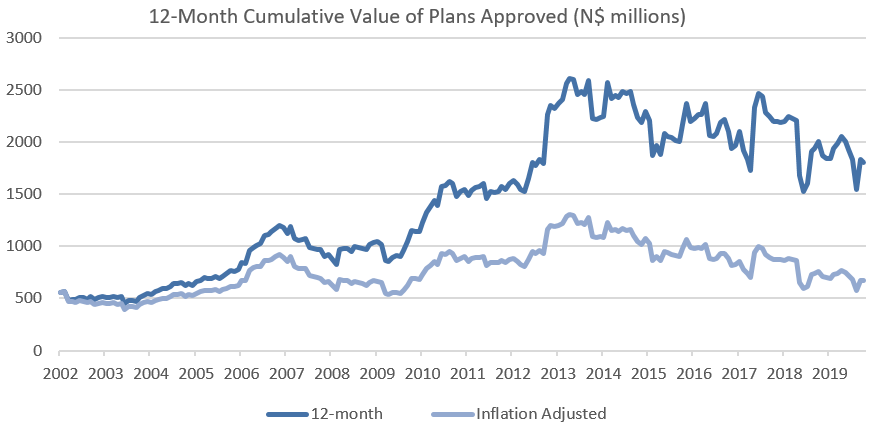
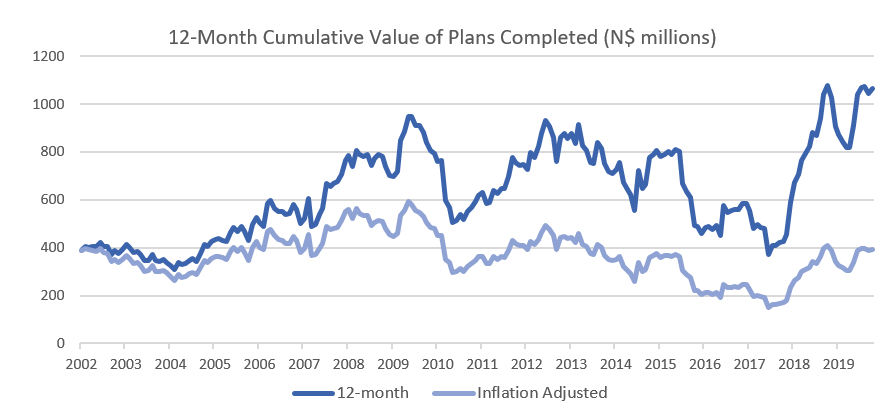
A total of 253 building plans were approved by the City of Windhoek in October, which is 100 more than in September. The value of building plans approved in October was N$155.8 million, an increase of 5.8% from the N$147.3 million worth of approvals in September. A total of 216 buildings with a total value of N$88.8 million were completed during October. On a year-to-date basis, 1,926 plans have been approved, 354 more than over the same period last year. The year-to-date value of approved building plans currently stands at N$1.73 billion, which is 9.7% lower than during the corresponding period in 2017. On a twelve-month cumulative basis, 2,277 building plans were approved worth approximately N$2.01 billion, 8.6% lower in value terms than this time last year.

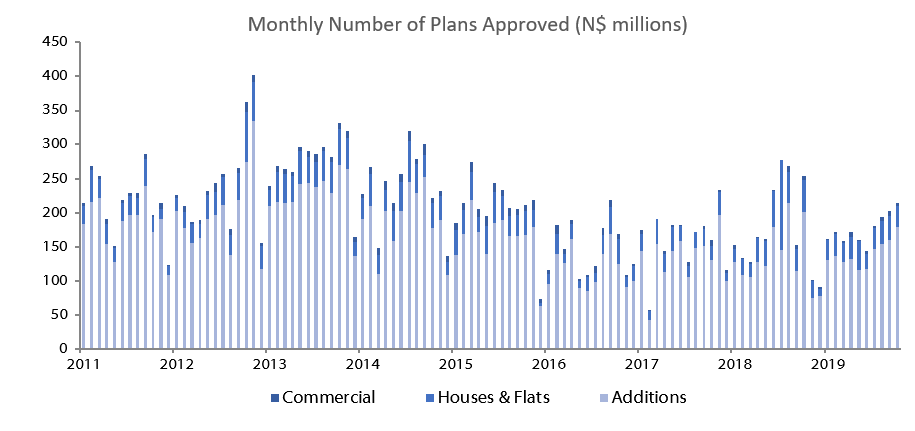
The largest portion of building plan approvals was once again made up of additions to properties, from both a number and value perspective. 201 additions were approved in October, a 54.6% m/m increase over September and almost matching the number of additions approved in August. Year-to-date 1,443 additions to properties have been approved with a cumulative value of N$850.7 million, a decline of 2.9% y/y in terms of value.

New residential units were the second largest contributor to building plans approved, with 47 approvals registered in October, 14 more than in September. 444 new residential units have been approved year-to-date, 200 more than during the corresponding period in 2017. In dollar terms, N$504.3 million worth of residential plans have been approved year-to-date, an increase of 37.0% when compared to the same period last year.

5 Commercial and industrial building plans were approved in October, worth N$9.4 million. This is one fewer than in the prior month, and a decrease of 88.0% m/m and 59.5% y/y in value terms. The number of new commercial units approved thus far in 2018 stands at 39 with a total value of N$378.5 million. This compares to 41 units valued at N$675.3 million approved over the same period in 2017. On a 12-month cumulative basis, the number of commercial and industrial approvals has increased by 2.1% y/y in October to 48 units, worth approximately N$400.6 million, a decrease of 44.3% in value terms over the prior 12-month period.

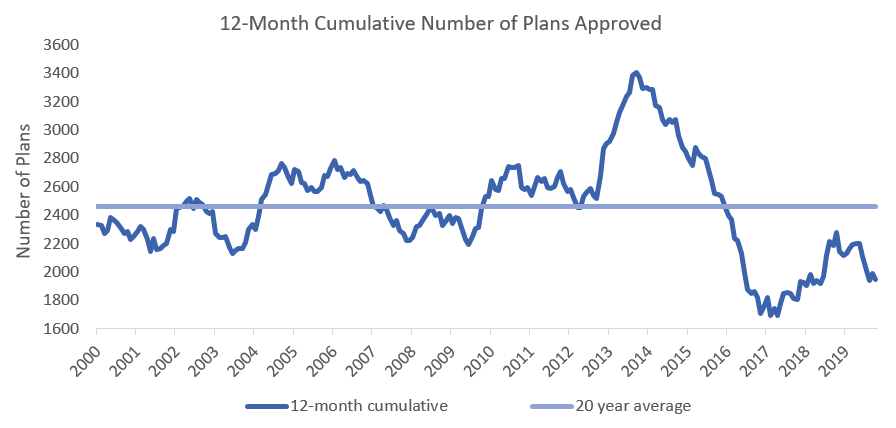
On a rolling 12-month basis, the number of building plan approvals have been ticking up since the end of last year. The majority of these approvals are additions to properties which are of low relative value, meaning that in value terms there is still stagnation in the amount of overall investment into the property market. Additions to properties are generally attributable to individuals and the increase in number and value of additions over the last year signals a return of some consumer confidence, although still fragile. We expect consumer confidence to lead business confidence, which, according to the building plans data, still seems to be depressed.

We suspect that Namibia is reaching the bottom of the economic downturn with a number of high frequency indicators such as PSCE pointing to a bottoming out. We expect consumer confidence to translate to business confidence as demand picks up but signs of a widespread upswing in economic activity are still missing at present and global headwinds do pose an increased threat to recovery in the Namibian economy. The outlook for Namibia remains fragile as a result, but barring any external shocks, or poor policy decisions, the country should start emerging from recession in 2019, although at a sedate pace.

NCPI – October 2018

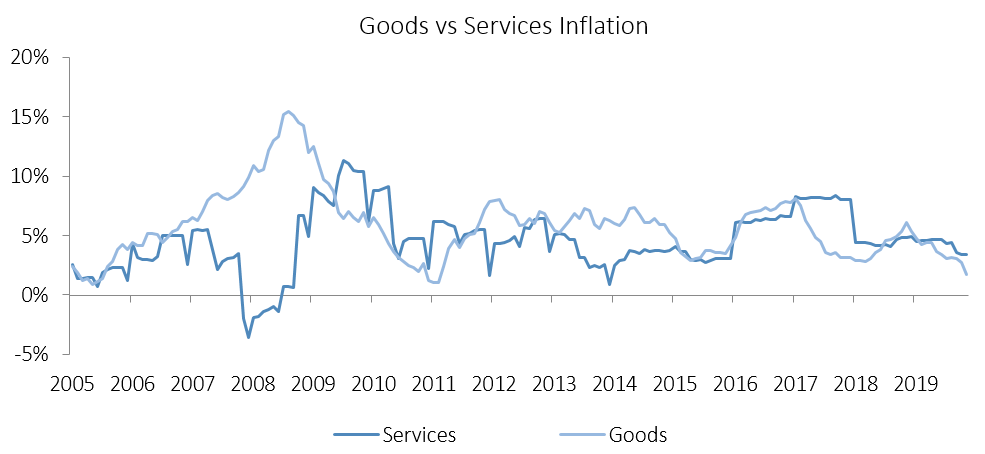
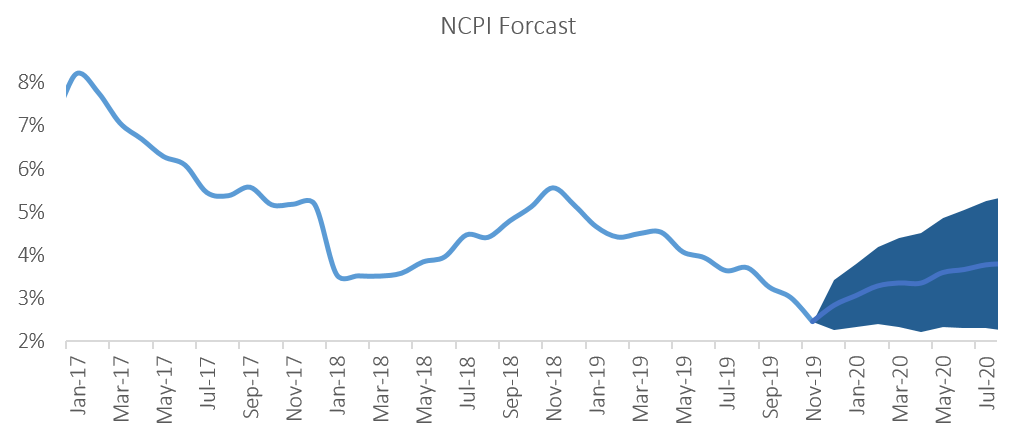
The Namibian annual inflation rate edged up to 5.1% y/y in October, up from 4.8% y/y in September. Prices in the overall NCPI basket increased 0.4% m/m in October. On an annual basis, prices in six of the twelve basket categories rose at a quicker rate in October than in the previous month, while three categories recorded slower rates of inflation and three categories remained unchanged. Prices for goods increased by 5.3% y/y while prices for services increased by 4.8% y/y.

Transport, the third largest basket item, was the largest contributor to annual inflation, accounting for 1.8% of the total 5.1% annual inflation figure. Transport prices increased by 1.2% m/m in October, which is slower than the 3.7% m/m increase recorded in September. However, on an annual basis, the 13.6% y/y increase in transport prices is faster than the 12.9% y/y growth recorded in September due to base effects. Prices in the three sub-categories all recorded increases on a year-on-year basis. Prices relating to the purchase of vehicles increased at a rate of 6.0% y/y, while prices relating to the operation of personal transport equipment increased by 15.5% y/y. Prices related to public transportation services increased by 18.0% y/y. The increase in oil prices for most of the year has been the driver of the increases in this basket category.

The Ministry of Mines and Energy increased fuel prices by 50c per litre in October. The minister stated that the exchange rate between the Namibian Dollar and the US Dollar (against which oil is priced) and the international oil price were the major factors contributing to the increase. The Ministry have announced further increases in November of 50c per litre and 70c per litre for Unleaded Petrol and Diesel, respectively, meaning that further pressure will be exerted on the transport price inflation. Oil prices peaked in October in Namibia dollar terms and have since declined by over 35% which may bring some relief in fuel prices in the coming months.

The Housing and utilities category was the second largest contributor to annual inflation due to its large weighting in the basket. Prices for this category remained flat m/m for a second month and increased 3.8% y/y. Prices in the electricity, gas and other fuels subcategory increased at 9.5% y/y, faster than inflation of 9.0% y/y recorded in September. The regular maintenance and repair of dwellings subcategory recorded an increase in prices of 3.7% y/y, which is a marginally faster rate of increase than the 3.4% y/y registered the previous month. Month-on-month, prices of all the subcategories remained unchanged.

Alcoholic beverages and tobacco, the fourth largest category, saw marginally slower price increases of 4.9% y/y and 0.3% m/m. Prices of alcoholic beverages rose 5.3% y/y while tobacco prices increased by 3.2% y/y.

New Vehicle Sales – October 2018

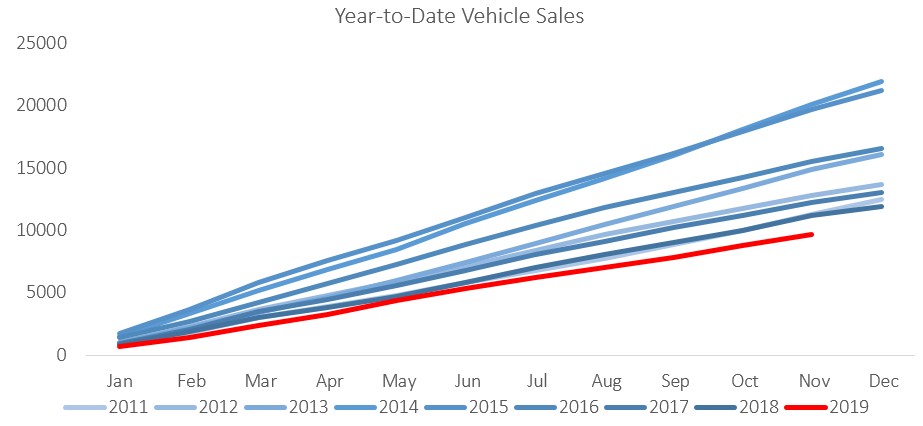
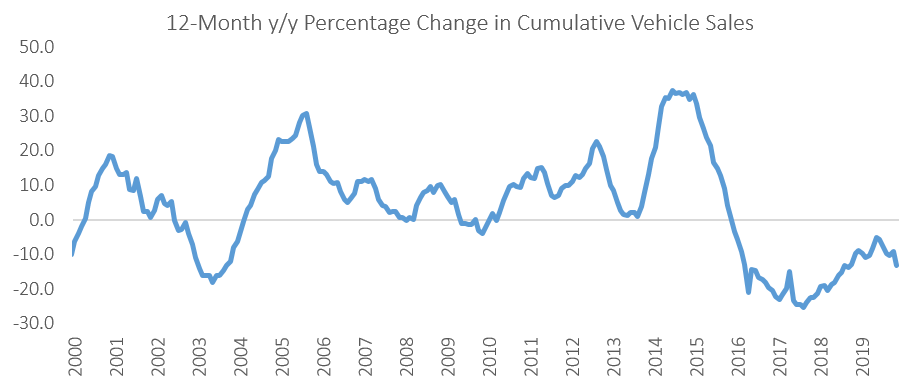
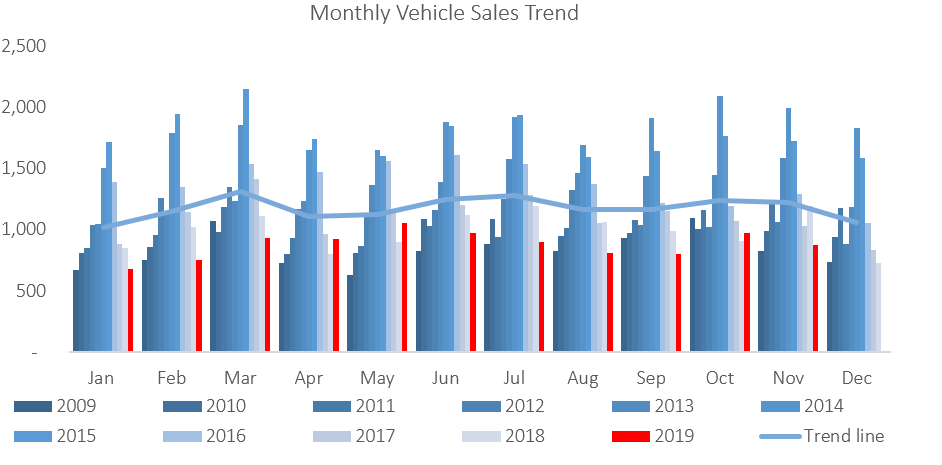
905 New vehicles were sold in October, representing a 7.8% decrease from the 982 vehicles sold in September, and an 8.7% decrease from October 2017 when 991 new vehicles were sold. Year-to-date 9,957 vehicles have been sold of which 4,361 were passenger vehicles, 5,049 light commercial vehicles, and 547 medium and heavy commercial vehicles. On a twelve-month cumulative basis, a total of 11,793 new vehicles were sold as at 31 October 2018, which represents a contraction of 13.1% from the 13,565 sold over the comparable period a year ago. New vehicle sales are thus still in decline despite the low base set in 2016 and 2017.

A total of 399 new passenger vehicles were sold during October, increasing by 19.8% m/m but declining by 2.0% y/y. Year-to-date passenger vehicle sales rose to 4,361, down 8.3% y/y. On a rolling 12-month basis new passenger vehicle sales were down 47.8% from the peak in April 2015.

Commercial vehicle sales reflect a similar picture, declining by 13.4% year-to-date and 15.4% y/y on a rolling 12-month basis. A total of 506 new commercial vehicles were sold in October, representing a contraction of 22.0% m/m and 13.4% y/y. 442 Light commercial vehicles, 18 medium commercial vehicles, and 46 heavy commercial vehicles were sold during the month. Light commercial vehicle sales have dropped 16.8% y/y, while medium commercial sales rose 5.9% y/y, and heavy and extra heavy sales rose by 27.8% y/y. On a twelve-month cumulative basis, light commercial vehicle sales dropped 16.9% y/y, while medium commercial vehicle sales rose 0.83% y/y, and heavy commercial vehicle sales rose 0.2% y/y. This is the first month since November 2015 that medium commercial sales have showed positive growth on a twelve-month cumulative basis, and the first month since February 2016 that heavy commercial sales have showed positive growth on a twelve-month cumulative basis. The positive growth is negligible at this point but it is possible that a floor in medium and heavy commercial vehicle sales has been found as companies that have been sweating assets start to replace those vehicles.

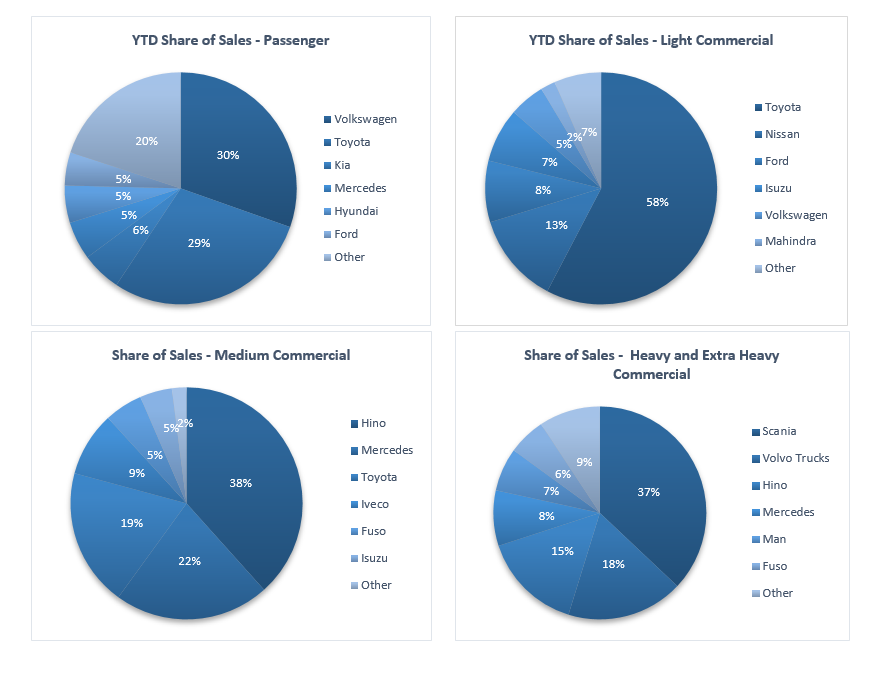
Toyota continues to lead the market for new passenger vehicle sales in 2018 based on the number of new vehicles sold, claiming 34.2% of the market, followed by Volkswagen with a 28.2% share. They were followed by Hyundai and Kia at 5.8% and 4.8% respectively, while the rest of the passenger vehicle market was shared by several competitors.

Toyota also remained the leader in the light commercial vehicle space with a 57.8% market share, with Nissan in second place with a 17.3% share. Ford and Isuzu claimed 8.5% and 5.0%, respectively, of the number of light commercial vehicles sold thus far in 2018. Hino leads the medium commercial vehicle category with 42.4% of sales while Scania remains number one in the heavy and extra-heavy commercial vehicle segment with 36.8% of the market share year-to-date.

The Bottom Line

The cumulative number of new vehicle sales continued to contract on a 12-month basis, amounting to 11,793 at the end of October. Government’s continued commitment to fiscal consolidation does have a direct effect on the demand for new vehicles. Government vehicle expenditure has fallen from N$1.02 billion in the 2014/15 fiscal year to N$22.2 million in 2017/18. In his Mid-Term Budget Review Speech last month, finance minister Calle Schlettwein left the revised vehicle budget unchanged at N$11.9 million from the budget tabled in March. N$1.4 million is allocated to the Auditor General’s office for vehicles, N$10.0 million to Health and Social Services and N$500,000 to the Justice ministry. For the 2019/20 year, N$10.0 million is allocated to Health and Social Services for vehicles. These figures dim the prospects for new vehicle sales in the short- to medium-term.