Building Plans – November 2018

A total of 101 building plans were approved by the City of Windhoek in November which represents a 60.1% m/m decrease from the 253 building plans approved in October. In value terms, approvals fell by N$114.8 million to N$41.0 million, representing a decline of 73.7% m/m and 76.1% y/y. The number of completions for the month of November stood at 180, valued at N$37.4 million. On a year-to-date basis, 2,027 plans have been approved, 220 more than over the same period last year. The year-to-date value of approved building plans currently stands at N$1.77 billion, which is 15.1% lower than during the corresponding period in 2017. On a twelve-month cumulative basis, 2,143 building plans were approved, an increase of 10.9% y/y, worth approximately N$1.87 billion, a decrease of 14.7% in value terms over the prior 12-month period.

The largest portion of building plan approvals in November were made up of additions to properties, from both a number and value perspective. 75 additions to properties were approved with a value of N$20.6 million, 82.2% less in value terms than in November 2017. Year-to-date 1,518 additions to properties have been approved with a value of N$871.3 million, declining 12.2% y/y in terms of value.

New residential units accounted for 25 of the total 101 approvals registered in November, a m/m decrease of 46.8% compared to the 47 residential units approved in October. In value terms, N$19.7 million worth of residential units were approved in November, 55.2% less than the N$44.1 million worth of residential approvals in October. Year-to-date 469 residential units have been approved, 192 more than in the corresponding period in 2017. In monetary terms, N$524 million worth of new residential plans have been approved year-to-date, an increase of 28.5% when compared to the corresponding period last year.

Only 1 new commercial unit valued at N$700,000 was approved in November, bringing the year-to-date number of approvals to 40, worth a total of N$379.2 million. On a rolling 12-month perspective the number of commercial and industrial approvals have slowed to 44 units worth N$385.2 million as at November, compared to the 49 approved units worth N$698.1 million over the corresponding period a year ago.

Building plan approvals took a sharp downturn in November, in terms of both number of approvals and value. Recent private sector credit extension data shows that growth in short-term credit such as overdrafts has been stronger than growth in long-term credit such as mortgage loans for both consumers and businesses. This is an indication that corporates are borrowing simply to stay afloat and are not borrowing to invest in expansionary projects, as is evident in the commercial building plan approval figures. Building plan approvals are a leading indicator for economic activity, which makes November’s low figures somewhat worrisome as it implies that businesses are not investing freely and that the economy is likely to remain under pressure in the short term.

New Vehicle Sales – December 2018


732 New vehicles were sold in December, down 38.2% m/m from the 1,185 vehicles sold in November, and a decrease of 11.3% y/y from the 825 new vehicles sold in December 2017. Year-to-date 11,875 vehicles have been sold, a 9.0% contraction from December last year and the lowest annual vehicle sales figure since December 2010. Of the 11,875 new vehicles sold during the year, 5,067 were passenger vehicles, 6,147 light commercial vehicles, and 661 medium and heavy commercial vehicles.

A total of 312 new passenger vehicles were sold during December, down 20.8% m/m and 15.4% y/y. 5,067 passenger vehicle were sold in total in 2018, an 8.2% decline from 2017 and lower annual sales than the preceding seven years. Passenger vehicle sales made up 42.7% of the total number of new vehicles sold during 2018, broadly in line with the trend over the last 4 years.

Commercial vehicle sales declined to 420 units in December, a 46.9% m/m, and 7.9% y/y contraction. During the month 382 light commercial vehicles, 11 medium commercial vehicles, and 27 heavy commercial vehicles were sold. On a year-on-year basis, light commercial sales have declined by 5.0%, medium commercial sales rose by 37.5%, and heavy and extra heavy sales have declined by 41.3%. On a twelve-month cumulative basis, light commercial vehicle sales dropped 10.2% y/y, while medium commercial vehicle sales rose 8.6% y/y, and heavy commercial vehicle sales fell 8.3% y/y.

Toyota continued to lead the market for new passenger vehicle sales in 2018, claiming 33.4% of the market, followed by Volkswagen with a 28.5% share. They were followed by Hyundai and Kia at 5.8% and 5.0% respectively, while the rest of the passenger vehicle market was shared by several other competitors.
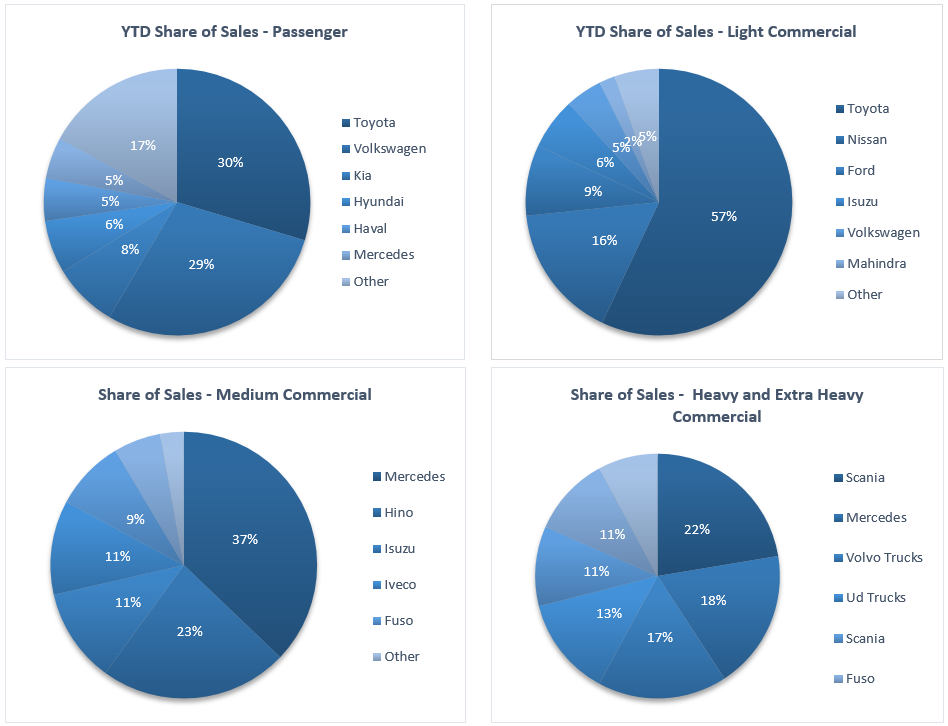
Toyota also remained the leader in the commercial vehicle space in 2018 with 56.1% market share, with Nissan in second place with an 18.8% share. Ford and Isuzu claimed 8.2% and 5.1% respectively of the number of new light commercial vehicles sold for the year. Hino lead the medium commercial vehicle category with 39.4% of sales while Scania was number one in the heavy and extra-heavy commercial vehicle segment with 35.5% of the market share during the year.

The Bottom Line

The outlook for new vehicle sales remains bleak with the cumulative number of new vehicle sales for the year amounting to 11,875, a decline of 9.0% from the cumulative number of vehicles sold in 2017 and a 47.6% contraction from the peak of 22,664 new vehicle sales recorded in April 2015. The fact that the 12-month cumulative figure is hovering around 2011 levels is a consequence of the recessionary environment we find ourselves in, characterised by depressed business and consumer confidence, as well as lower government spending. December new vehicle sales have historically been low when compared to most other months as people go on holiday and dealerships close, but 2018’s December figure was the lowest since 2008, pointing to the ongoing impact of the current recession on demand and investment.

NCPI – December 2018

The Namibian annual inflation rate moderated to 5.1% y/y in December, following the 5.6% y/y increase in prices recorded in November. Prices in the overall NCPI basket decreased 0.2% m/m. The annual average inflation rate for 2018 was 4.3%, compared to 6.2% in 2017. On a year-on-year basis, overall prices in five of the twelve basket categories rose at a quicker rate in December than in November, with four categories recording slower rates of inflation and three categories remained unchanged. Prices for goods increased by 5.3% y/y while prices for services increased by 4.9% y/y.

Transport, the third largest basket item, was the largest contributor to annual inflation, accounting for 1.5% of the total 5.1% annual inflation rate. Prices for this basket item decreased by 1.8% m/m, but increased 10.9% y/y in December. Prices in all three sub-categories recorded increases on a year-on-year basis. Prices relating to the purchase of vehicles increased at a rate of 6.8% y/y, while prices related to public transportation services increased by 18.2% y/y due to the increases in taxi and bus fares in September.

The operation of personal transport equipment saw a price decrease of 2.8% m/m but an increase of 10.5% y/y. The month-on-month price decrease for this subcategory is a result of the cut in fuel pump prices announced by the Ministry of Mines and Energy at the beginning of December. The minister cut the price of unleaded and diesel by 100 cents per litre and 40 cents per litre, respectively, due to a decrease in the global oil price.

The price of Brent Crude oil increased by more than 20% in the first half of 2018, and hit a four-year high of US$86.29 per barrel in October. The price of oil has since fallen about 30% due to rising inventories and rapidly rising shale oil production in the US. Although the oil price has recovered somewhat from the beginning of the year, it continues to be weighted down by weaker economic growth forecasts in China.

Food and non-alcoholic beverages accounted for 0.9% of the total annual inflation rate. Food inflation is currently running at 5.2% y/y, up from the 4.7% y/y figure seen in November. The sub-categories of food and non-alcoholic beverages showed relatively low monthly increases, while six of the sub-categories showed monthly decreases. Prices of mineral waters, soft drinks and juices decreased by 1.8% m/m, while the prices of other non-alcoholic beverages declined 1.0% m/m in December. On an annual basis, prices of vegetables and fruits increased 12.8% y/y and 8.1% y/y respectively. Bread and cereal prices rose 7.9% y/y. The slow increase in meat, fish, and soft drink and mineral water prices helped keep food inflation tethered within low- to mid-single-digit levels for the year.

The Housing and utilities category was the third largest contributor to annual inflation due to its large weighting in the basket. Prices for this category remained flat m/m and increased 3.1% y/y. Prices in the electricity, gas and other fuels subcategory increased 4.9% y/y, significantly slower than the inflation of 8.7% recorded in November, due to base effects. The regular maintenance and repair of dwellings subcategory registered an increase in prices of 2.5% y/y although prices decreased by 0.7% m/m. This follows a 0.3% decrease in prices in this category in November.

The moderation in the Namibian annual inflation rate to 5.1% was somewhat expected given the cut in fuel pump prices in December. We expect transport inflation to continue its slower growth rate on an annual basis in the short-term due to the further fuel pump price cut in January, relatively low oil prices, and the stronger exchange rate. The above-mentioned factors hold true for South African inflation too and as such filter into the SARB’s Monetary Policy Committee forecasts and decisions. Relief from lower oil and fuel prices should lead to a slightly more dovish SARB, all else equal, which is likely to lead to interest rates being left unchanged later this week when the SARB MPC meets.

Local food prices might increase going forward if imports of cloven-hoofed animals and their products remain banned for some time due to the outbreak of foot-and-mouth disease in the Limpopo province in South Africa.