New Vehicle Sales – March 2019

A total of 936 new vehicles were sold in March, representing a 24.6% m/m increase from the 751 vehicles sold in February. It should be noted that March vehicle sales have a seasonal effect of being slightly higher due to it being the end of the tax year. Year-to-date, 2,365 vehicles have been sold of which 1,118 were passenger vehicles, 1,135 light commercial vehicles, and 112 medium and heavy commercial vehicles. This is a 20.8% decline in the total number of new vehicles sold during the first quarter of 2019 when compared to 2018. On a twelve month-cumulative basis, vehicle sales continue to wane with a total of 11,285 new vehicles sold as at March 2019, down 10.3% from the 12,577 sold over the comparable period a year ago, and the lowest since November 2010.

422 New passenger vehicles were sold during March, increasing by 19.2% m/m. From a year-on-year perspective however, March new passenger vehicle sales were 16.8% lower than the 507 units sold in March 2018. Year-to-date, passenger vehicle sales rose to 1,118, reflecting lower annual sales than the preceding 8 years, and a 20.9% decline from the first quarter of 2018.

A total of 514 new commercial vehicles were sold in March, representing an increase of 29.5% m/m, but a contraction of 14.8% y/y. Of the 514 commercial vehicles sold in March, 483 were classified as light, 15 as medium and 16 as heavy. On an annual basis, light commercial sales fell by 12.8%, medium commercial sales grew by 7.1% while heavy and extra heavy sales have contracted by 54.3%. On a twelve-month cumulative basis, light commercial vehicle sales dropped 11.7% y/y, while medium commercial vehicle sales rose 13.1% y/y, and heavy commercial vehicle sales fell 6.3% y/y. This is the sixth consecutive month that medium commercial sales have showed growth on a twelve-month cumulative basis.

Toyota retook the lead from Volkswagen in March in terms of year-to-date market share of new passenger vehicles sold. Toyota claimed 31.6% of the market, followed closely by Volkswagen with 28.3% of the market. They were followed by Kia and Hyundai with 5.9% and 5.5% of the market respectively, while the rest of the passenger vehicle market was shared by several other competitors.

Toyota remained the leader in the light commercial vehicle space with a 67.8% market share, with Ford in second place with a 9.8% market share. Volkswagen and Isuzu claimed 5.3% and 4.5%, respectively, of the number of light commercial vehicles sold thus far in 2019. Hino leads the medium commercial vehicle segment with 37.2% of sales while Scania was number one in the heavy and extra-heavy commercial vehicle segment with 29.0% of the market share year-to-date.

The Bottom Line

New vehicle sales remained depressed in March as 12-month cumulative new vehicle sales have declined by 10.3% y/y to 11,285 at the end of March, representing a decline of 50.2% from the peak of 22,664 new vehicle sales recorded in April 2015. Government’s continued commitment to fiscal consolidation does have a direct effect on the demand for new vehicles. Government vehicle expenditure has fallen from N$1.02 billion in the 2014/15 fiscal year to N$22.2 million in 2017/18. In his Budget Review Speech last month, finance minister Calle Schlettwein left the revised vehicle budget unchanged at N$11.9 million from the mid-term budget tabled in October last year. N$1.4 million is allocated to the Auditor General’s office for vehicles, N$10.0 million to Health and Social Services and N$500,000 to the Justice ministry. For the 2019/20 year, N$10.0 million is allocated to Health and Social Services for vehicles. These figures dim the prospects for new vehicle sales in the short- to medium-term.

NCPI – March 2019

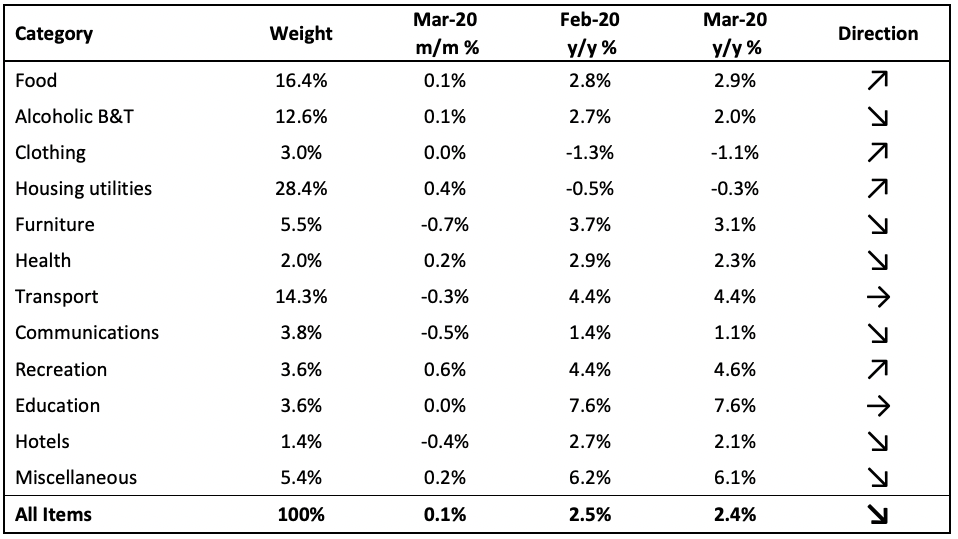
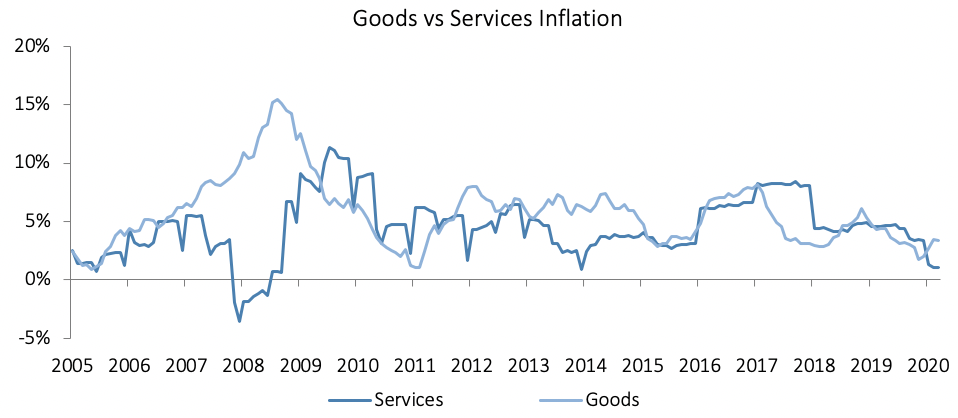
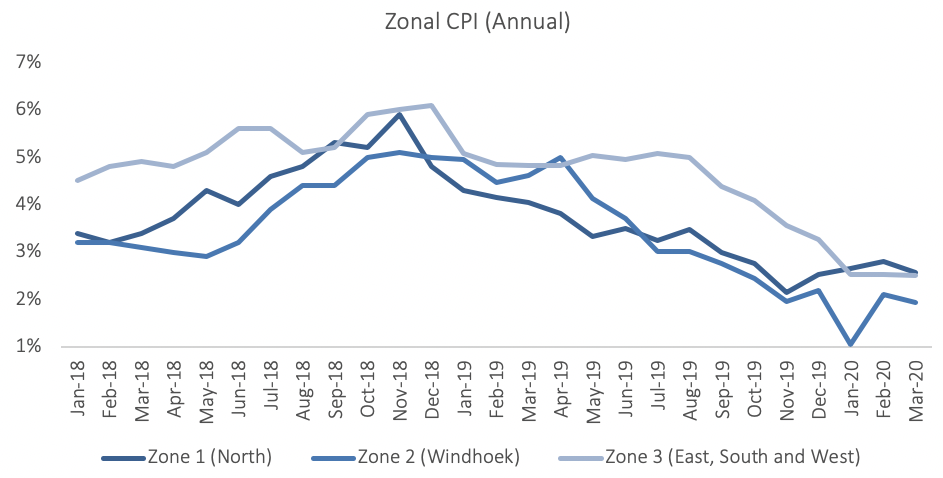
The Namibian annual inflation rate edged up to 4.5% y/y in March, after moderating to 4.4% y/y in February. Prices in the overall NCPI basket increased by 0.2% on a monthly basis in March, following deflation of 0.1% m/m in February.  On an annual basis, prices in five of the twelve basket categories rose at a quicker rate in March than in February. One category remained unchanged, while the rate of price increases in six categories slowed for the month of March. Prices for goods increased at a rate of 4.4% y/y in March, while prices for services increased by 4.6% y/y.

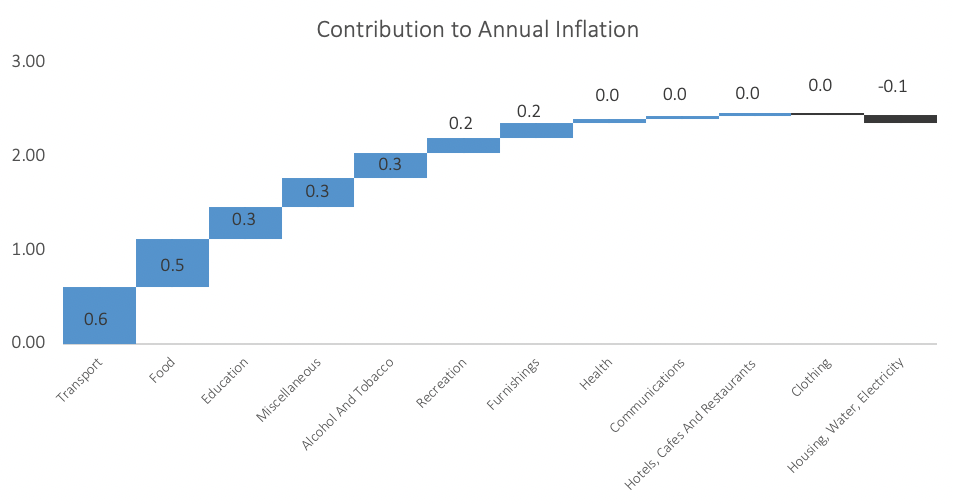
Food & non-alcoholic beverages, the second largest basket item by weighting, continued to be the largest contributor to annual inflation, accounting for 1.0% of the 4.5% annual inflation rate. Prices in this category were unchanged on a month-on-month basis, but rose by 5.8% y/y. Prices in all thirteen sub-categories recorded increases on a year-on-year basis, with the largest increases being observed in the prices of vegetables, fruits and bread and cereals. The increase on an annual basis, is likely a result of increased transport prices towards the end of last year which has filtered through to food prices, coupled with poor rainfall during Namibia’s rainy season that affects local food production.

Transport, the third largest basket item, was the second largest contributor to annual inflation, accounting for 0.9% of the total 4.5% annual inflation figure. Transport prices fell by 0.3% m/m in March, but increased by 6.9% y/y. The purchase of vehicles subcategory saw price decreases of 0.8% m/m, but an increase of 4.2% y/y. Oil prices have steadily been picking up since the beginning of the year, reaching US$68 per barrel at the end of March. The Ministry of Mines and Energy once again decided to keep fuel pump prices unchanged for the month, stating that the government will finance the under-recoveries.

The alcoholic beverages and tobacco category recorded price increases of 0.9% m/m and 6.7% y/y, an increase over the figures seen in the prior month. Prices of alcoholic beverages increased at a rate of 6.9% y/y, while tobacco prices increased at a rate of 6.3% y/y.

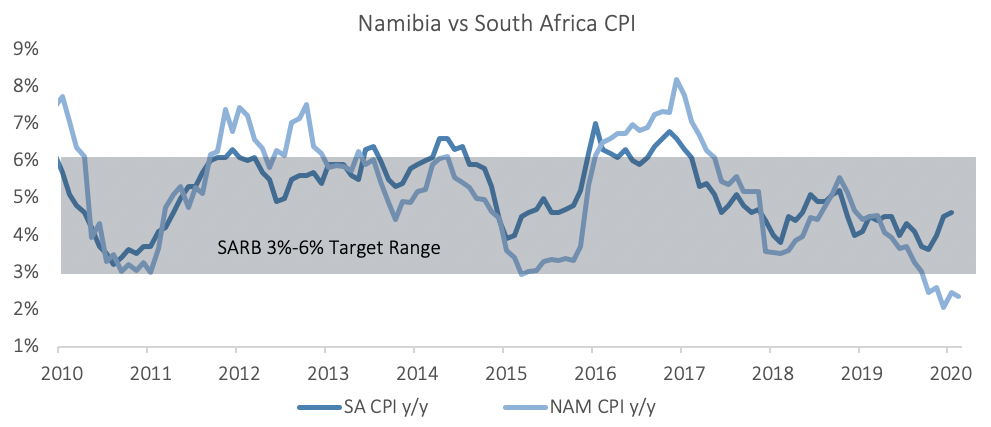
The Namibian annual inflation rate of 4.5% y/y continues to trend somewhat higher than that of neighbouring South Africa (February: 4.1% y/y). The poor rainfall Namibia experienced during the rainy season affects local food production and will likely lead to higher food inflation going forward, as the shortfall will lead to an increase imports. Oil prices have also been climbing steadily since the beginning of the year, and while the government has managed to finance the under-recoveries up until now, we expect fuel prices to increase at some point in the coming months.

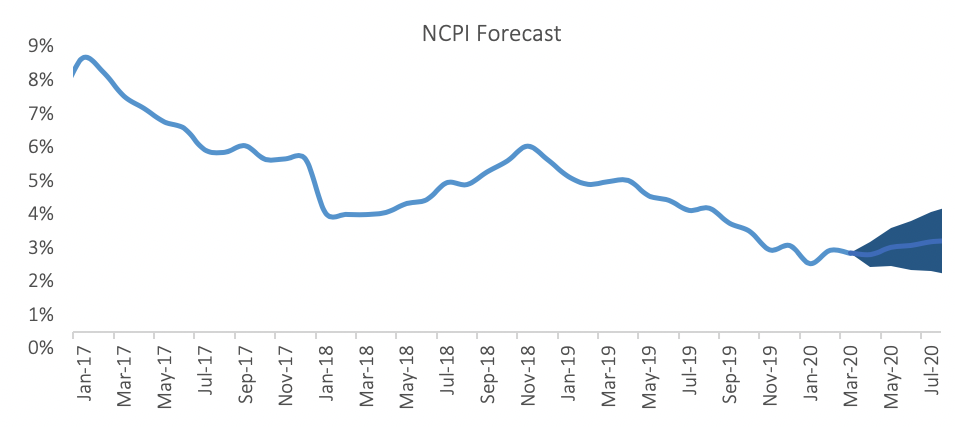
The Bank of Namibia (BoN) has decided to maintain the Repo rate at 6.75% at its MPC meeting last week, following a review of global, regional and domestic economic and financial developments. The BoN expects inflation to average 4.7% in 2019. IJG’s inflation model forecasts average inflation of 4.3% in 2019. However, oil prices and subsequent transport inflation poses the largest upside risk to this forecast.

PSCE – February 2019

Overall

Total credit extended to the private sector (PSCE) increased by N$606.7 million or 0.63% m/m in February, bringing the cumulative credit outstanding to N$97.7 billion. On a year-on-year basis, private sector credit extension increased by 6.59% in February, compared to 7.16% in January. From a rolling 12-month basis, N$6.04 billion worth of credit was extended to the private sector. Of this cumulative issuance, individuals took up credit worth N$3.46 billion, while N$1.99 billion was issued to corporates. Claims on non-resident private sectors totaled N$587.4 million, on a 12-month cumulative basis.

Credit Extension to Individuals

Credit extended to individuals increased by 6.4% y/y in February, growing at a slightly slower pace than the 6.7% y/y increase recorded in January. On a monthly basis, household credit grew by 0.4% following an increase of 0.3% m/m recorded in January. Household demand for overdraft facilities was once again strong in February, increasing by 2.2% m/m and 4.7% y/y, compared to the 2.3% m/m and 2.7% y/y increase seen in January. The value of mortgage loans extended to individuals increased by 0.3% m/m and 7.3% y/y. Installment credit remained depressed, increasing by 1.1% m/m, but contracting by 5.4% y/y.

Credit Extension to Corporates

Credit extension to corporates ticked up slightly month-on-month, increasing by 1.0% following a 0.1% increase in January. Year-on-year credit extension to corporates increased by 5.4% in February, increasing at a slower rate than the 6.3% y/y recorded in January. The increase in overall loans to corporates was mostly driven by corporates’ continued use of short-term credit facilities, in particular overdrafts, which increased by 3.7% m/m and 13.1% y/y. Other loans and advances, which consists of credit card debt, personal and term loans, extended to businesses increased by 26.8% y/y, but contracted by 0.2% m/m. Mortgage loans extended to corporates increased by a low 1.2% y/y, but decreased by 0.7% m/m.

Banking Sector Liquidity

The overall liquidity position of commercial banks improved significantly during February, increasing by N$2.10 billion to reach an average of N$2.38 billion. Bank of Namibia credits this improvement in liquidity to higher government spending as well as higher mineral proceeds during the period. The higher liquidity resulted in a decrease in use of the BoN’s repo facility by commercial banks, with the outstanding balance of repo’s decreasing from N$2.29 billion at the start of February to N$645.7 million by month end.

Reserves and Money Supply

Broad money supply rose by N$9.97 billion or 10.5% y/y in February following a 7.6% y/y increase in January, as per the BoN’s latest money statistics release. Foreign reserve balances rose by 3.1% m/m to N$31.6 billion in February. The BoN stated that the increase was mostly due to increased net capital inflows by commercial banks, coupled with exchange rate revaluations.

Outlook

Overall PSCE growth in February moderated for a third consecutive month on a year-on-year basis, increasing by 6.6%. From a 12-month rolling perspective, credit issuance is up 36.6% from the N$4.42 billion issuance observed at the end of February 2018, with individuals taking up most (57.3%) of the credit extended over the past 12 months.

As has been the case for the past few months, most of the growth in PSCE for February has stemmed from shorter-dated debt, which is unlikely to drive meaningful expansion of productive capacity. Instalment credit extended to corporates, remained depressed, contracting by 9.3% y/y in February. The persistent contraction in instalment credit to corporates (since February 2017) is a further indication that businesses are financing fewer and fewer capital goods and as such, are not expanding operations.