Twitter Timeline
[custom-twitter-feeds]
Categories
- Calculators (1)
- Company Research (303)
- Capricorn Investment Group (52)
- FirstRand Namibia (54)
- Letshego Holdings Namibia (26)
- Mobile Telecommunications Limited (8)
- NamAsset (3)
- Namibia Breweries (46)
- Oryx Properties (59)
- Paratus Namibia Holdings (7)
- SBN Holdings Limited (18)
- Economic Research (680)
- BoN MPC Meetings (14)
- Budget (19)
- Building Plans (147)
- Inflation (147)
- Other (28)
- Outlook (17)
- Presentations (2)
- Private Sector Credit Extension (145)
- Tourism (7)
- Trade Statistics (4)
- Vehicle Sales (148)
- Media (25)
- Print Media (15)
- TV Interviews (9)
- Regular Research (1,889)
- Business Climate Monitor (75)
- IJG Daily (1,692)
- IJG Elephant Book (12)
- IJG Monthly (108)
- Team Commentary (250)
- Danie van Wyk (61)
- Dylan van Wyk (27)
- Eric van Zyl (16)
- Hugo van den Heever (1)
- Leon Maloney (11)
- Top of Mind (4)
- Zane Feris (12)
- Uncategorized (7)
- Valuation (4,726)
- Asset Performance (120)
- IJG All Bond Index (2,209)
- IJG Daily Valuation (1,893)
- Weekly Yield Curve (503)
Meta
Category Archives: Economic Research
NCPI – September 2020
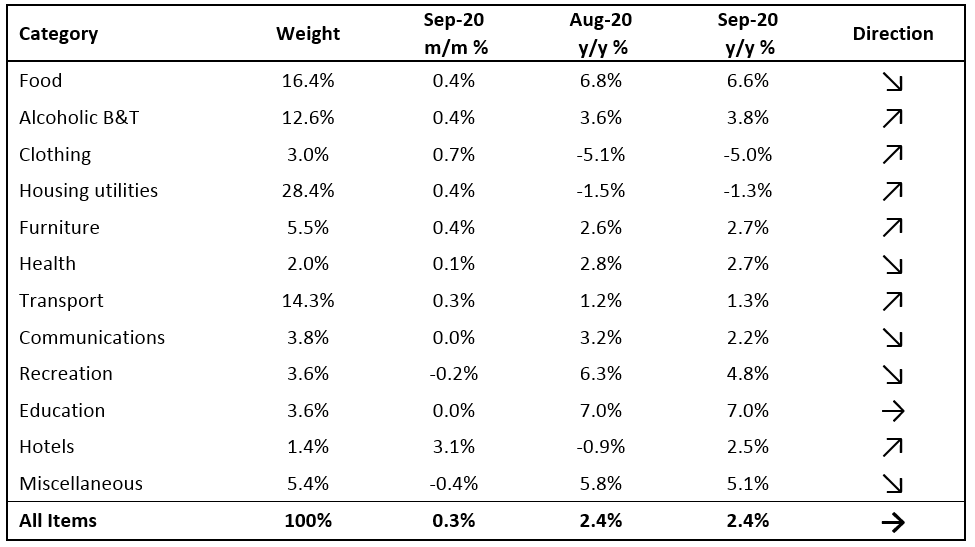
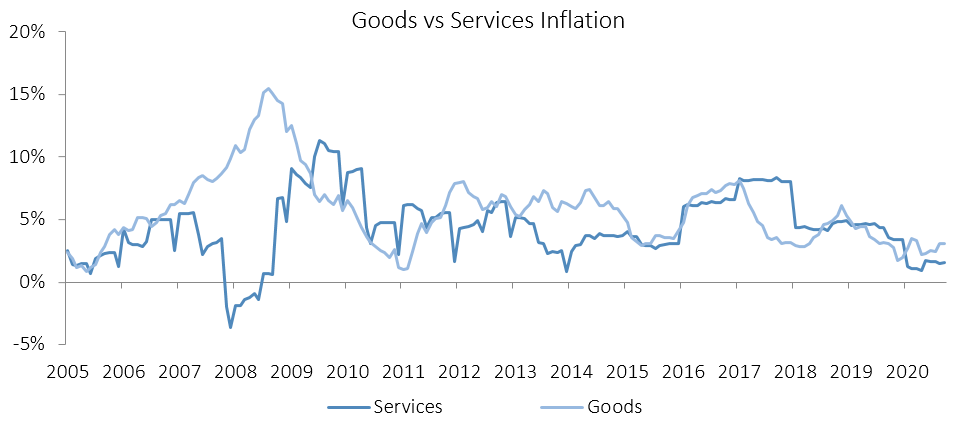
The Namibian annual inflation rate remained at 2.4% y/y in September, with prices in the overall NCPI basket increasing by 0.3% m/m. On a year-on-year basis, overall prices in six of the twelve basket categories rose at a quicker rate in September than in August, with five categories recording slower rates of inflation and one category recording an increase consistent with the prior month. Prices for goods increased by 3.1% y/y while prices for services rose 1.5% y/y.
The food & non-alcoholic beverages category remained the largest contributor to annual inflation in September, accounting for 1.2 percentage points of the total 2.4% annual inflation rate. The category recorded price increases of 1.2% m/m and 6.6% y/y. Prices in all thirteen sub-categories recorded increases on a year-on-year basis with the largest increases being observed in the prices of fruits which increased by 17.9% y/y and vegetables which increased by 12.2% y/y. Price increases in meat products and fish also remained elevated at 9.4% y/y and 9.0% y/y respectively.
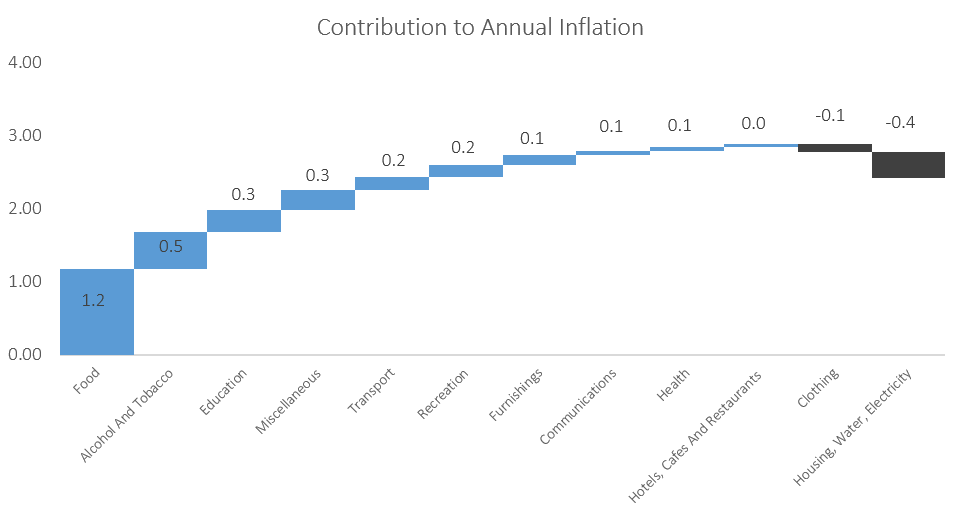
Alcoholic beverages and tobacco prices, making up approximately 12.6 of the overall inflation basket, was the second largest contributor to the annual inflation rate in September, with prices of the basket item increasing by 3.8% y/y. On a month-on-month basis prices of the basket item rose by 0.4% m/m. Prices for alcoholic beverages rose by 0.2% m/m and 3.4% y/y, while tobacco prices increased by 1.2% m/m and 5.6% y/y.
Transport, one of the largest inflation basket categories, continues to experience relatively low inflation at 1.3% y/y. This is largely as a result of low oil prices, which remain down in Rand terms when compared to a year ago. A notable exception however is the 13.4% y/y inflation on public transportation services as a result in the increase in bus and taxi fares due to campaigning by the Namibia Transport and Taxi Union (NTTU) in light of government’s restriction on the number of passengers allowed per vehicle. This highlights just one of the ways in which lockdown measures have increased costs on the public, and often specifically on the more vulnerable members of society.

Global growth remains under pressure and monetary policy remains very accommodative, pointing to low global inflation expectations. Monetary easing by developed markets has reached previously unknown levels and to a large extent enabled developing markets and emerging economies to follow suit, albeit to a lesser extent. The BoN noted in its August Monetary Policy Statement that most developing markets and emerging economies have cut interest rates at their most recent monetary policy meetings, with the notable exception of China which kept rates steady. The inflation environment is expected to remain benign in most markets which should underpin a global economic recovery.
Inflationary pressure in Namibia remains weak and continues to trend below South African inflation. IJG’s inflation model forecasts an average inflation rate of 2.3% y/y in 2020 and 3.7% y/y in 2021. While risks remain to the upside we see these as muted in the short term in what is currently a very accommodative global monetary environment. Oil prices and a further escalation of the US-China trade war remain the largest risks in the short-term, while domestic and South African fiscal deterioration pose medium-term risks as debt levels increase unchecked, eating into the already limited productive portion of expenditure.

Building Plans – September 2020
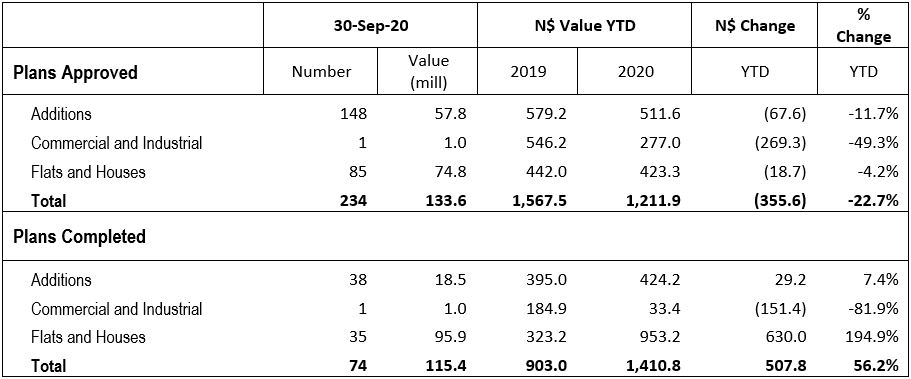
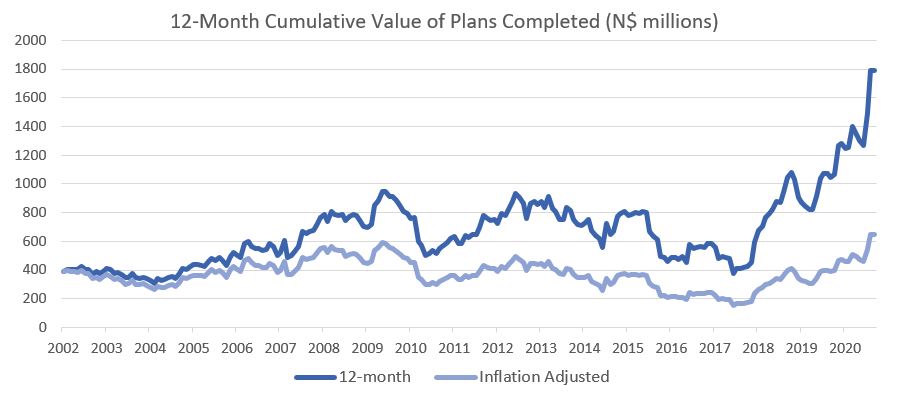
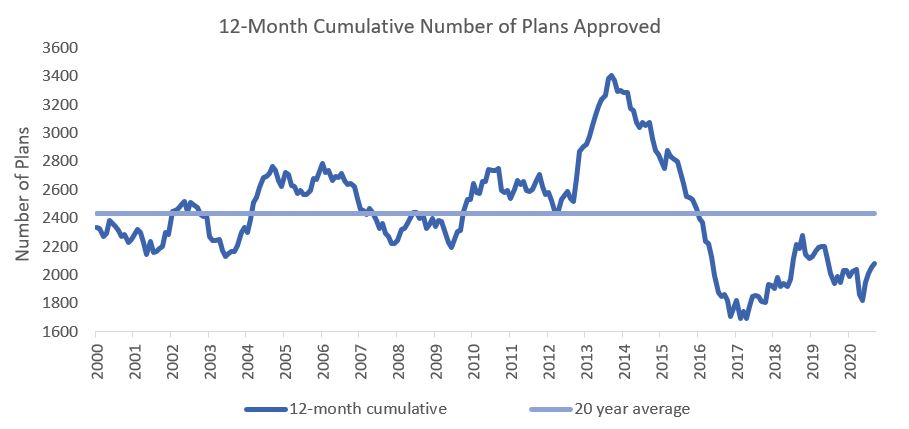
The City of Windhoek approved a total of 234 building plans worth N$133.6 million in September. In value terms approvals rose by 19.3% m/m but fell by 69.1% y/y. A total of 74 completions to the value of N$115.4 million were recorded in September, a decrease of 67.1% y/y in number but a 5.0% y/y increase in value. The year-to-date value of approved building plans reached N$1.21 billion, 22.7% lower than the comparative period a year ago. On a twelve-month cumulative basis, 2,081 building plans were approved worth approximately N$1.64 billion, 10.5% lower in value terms than approvals at the end of September 2019.

The majority of building plan approvals were made up of additions to properties. For the month of September 148 additions were approved worth N$57.8 million, 6.3% less in number and 9.6% less in value than in August. Year-to-date, 1,166 additions have been approved with a value of N$511.6 million, a 4.5% y/y decrease in number and 11.7% y/y decrease in value. 38 additions worth N$18.5 million were completed during the month. In 2020 thus far 839 additions have been completed worth N$424.2 million, an increase of 3.2% y/y in number and 7.4% y/y in value.

New residential units accounted for 85 of the total 234 approvals registered in September, worth N$74.8 million. Year-to-date 391 new residential units have been approved worth N$423.3 million, an increase of 37.2% y/y in number but a decrease of 4.2% y/y in value. 35 new residential units worth N$95.9 million were completed during the month, increases of 84.2% y/y in number and 294.1% y/y in value. Year-to-date 592 residential units have been completed at a value of N$953.2 million, increasing by 163.1% y/y in number and 194.9% y/y in value. On a 12-month cumulative basis the number and value of residential completions are at the highest levels since 2005.
Only 1 new commercial unit, valued at N$1.0 million, was approved in September, bringing the year-to-date number of commercial and industrial approvals to 33, worth a total of N$277.0 million. On a rolling 12-month basis, the number of commercial and industrial approvals have slowed further to 45 worth N$306.4 million as at September, representing an increase of 2.3% y/y in number and a decrease of 45.0% y/y in value.
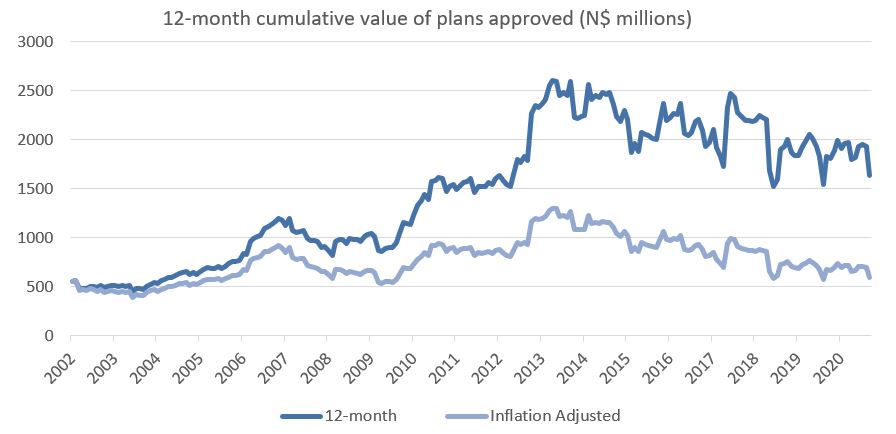
As illustrated in the figure above, the cumulative value of building plans approved continues to trend downward in both nominal and inflation adjusted terms. As approvals is a forward-looking measure of expected construction activity this does not bode well for economic activity in the capital in general. What may be positive however is the ratio of completions to lagged approvals seems to indicate a higher proportion of approved building plans actually being completed. This may partly explain why the approvals data failed to predict the below visible increase in completions. Another possible explanation is that there has been a completions backlog (paperwork backlog) which is now being processed, in which case the below graph does not tell us much about when the actual construction activity took place. We thus caution reading too much into the completions data and continue to look at approvals as a leading economic indicator.