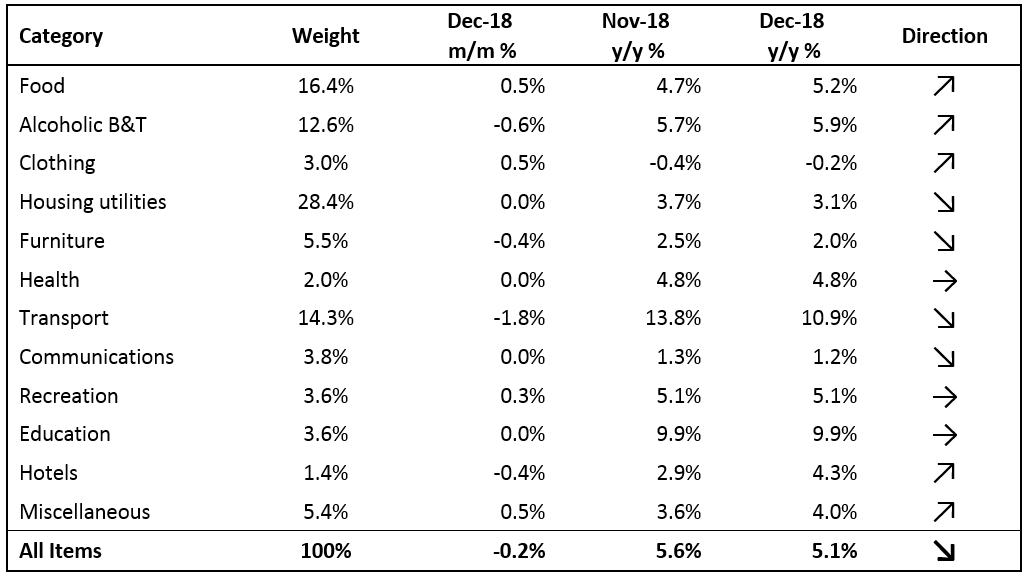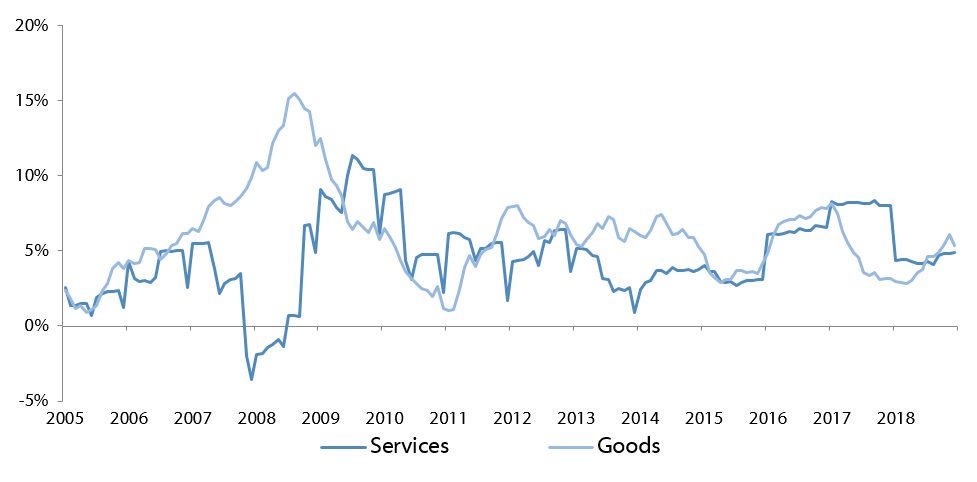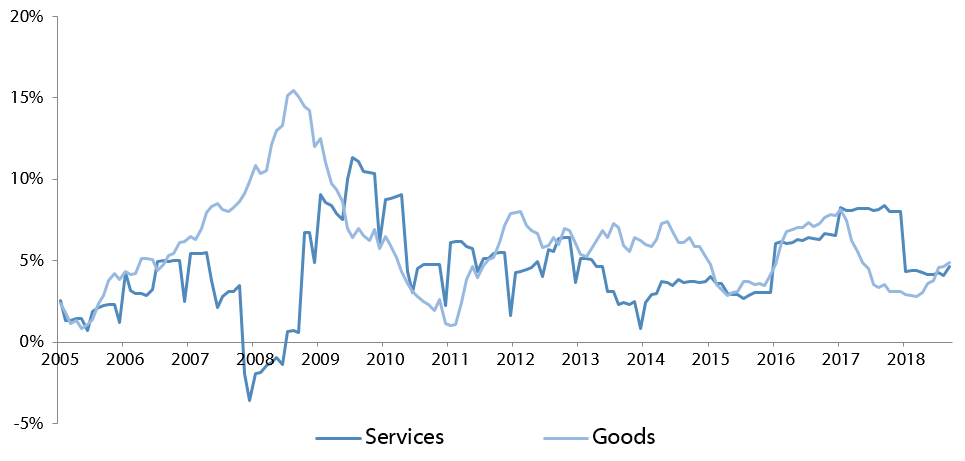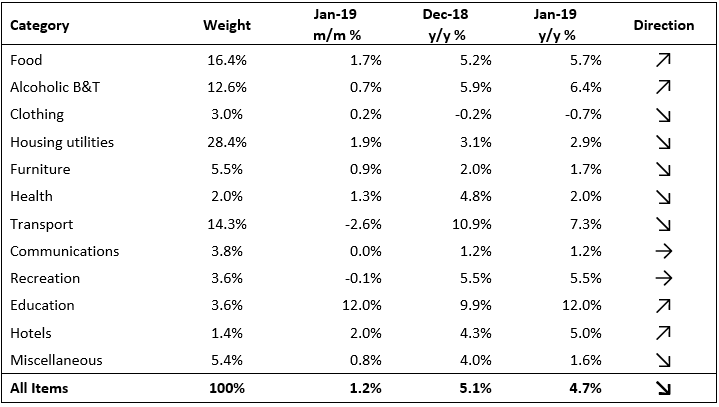
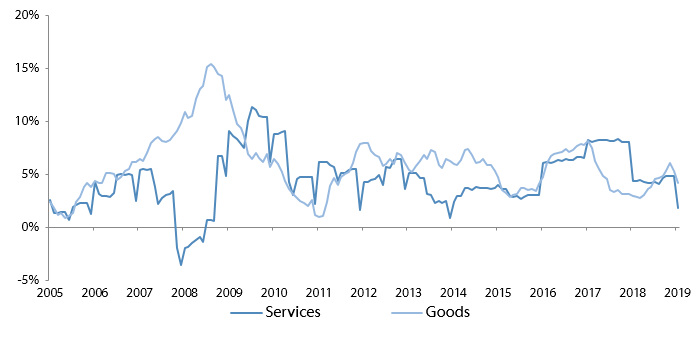
The Namibian annual inflation rate edged lower for a second consecutive month, moderating to 4.7% y/y in January, following December’s 5.1% y/y increase in prices. Prices in the overall NCPI basket increased 1.2% m/m, the largest monthly increase in prices over the last twelve months. It has become the norm for rental price adjustments to be passed through in January, which explains the elevated monthly inflation rate. On a year-on-year basis, overall prices in four of the twelve basket categories rose at a quicker rate in January than in December, while six categories recording slower rates of inflation, and two categories recorded unchanged inflation rates. Prices for goods increased by 4.2% y/y while price increases for services slowed to 1.9% y/y in January from 4.9% y/y in December.
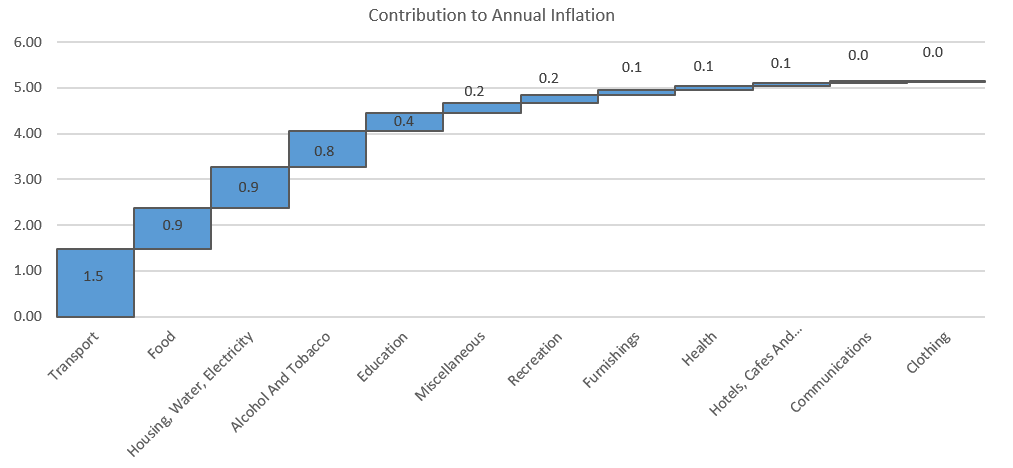
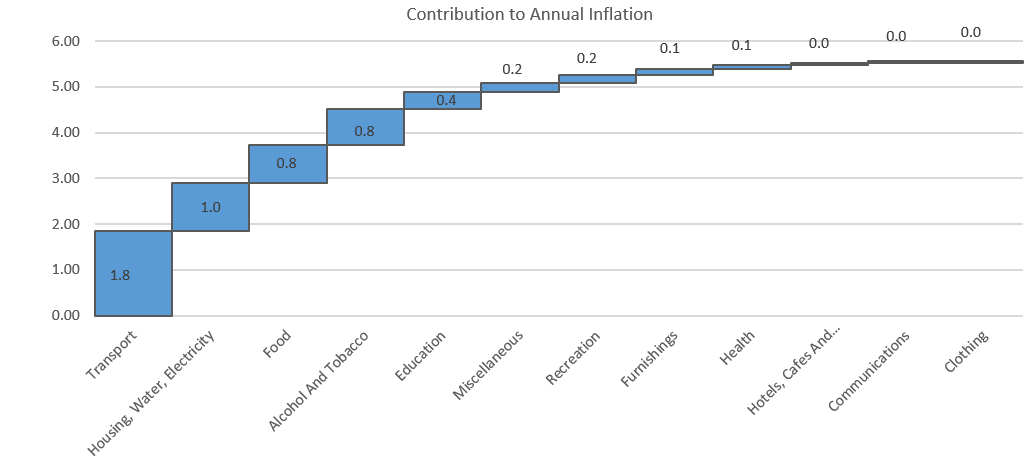
The effects of the accelerated pace at which transport prices increased since July 2018 have now passed-through to food prices. Food & non-alcoholic beverages (FNAB) and transport, the second and third largest basket items by weighting, respectively, were equally the largest contributors to annual inflation in January. Together these basket categories accounted for 2.0% of the total 4.7% annual inflation rate. Prices for the FNAB basket increased by 1.7% m/m and 5.7% y/y in January, while prices for transport decreased by 2.6% m/m but increased 7.3% y/y. Prices in all thirteen FNAB sub-categories recorded increases on a year-on-year basis with the largest increases being observed in the prices of vegetables, fruits, bread and cereals.
rices in two of the three transport sub-categories recorded slower annual price increases compared to December, while prices in the one sub-category increased at a quicker pace in January. Price increases relating to the purchase of vehicles slowed to 6.0% y/y in January compared to 6.8% y/y in December, while prices related to public transportation services increased by 18.6% y/y owing to the increases in taxi and bus fares in September.
The operation of personal transport equipment sub-category saw prices decrease by 2.8% m/m but increase 10.5% y/y. This month-on-month decrease in the costs of operating personal transportation can be attributed to the decrease in fuel pump prices enacted by the Ministry of Mines and Energy (MME) in January. The MME cut unleaded petrol and diesel prices in January by 90 c/l and 100 c/l, respectively, thus extending motorists more relief following fuel pump price cuts in December.
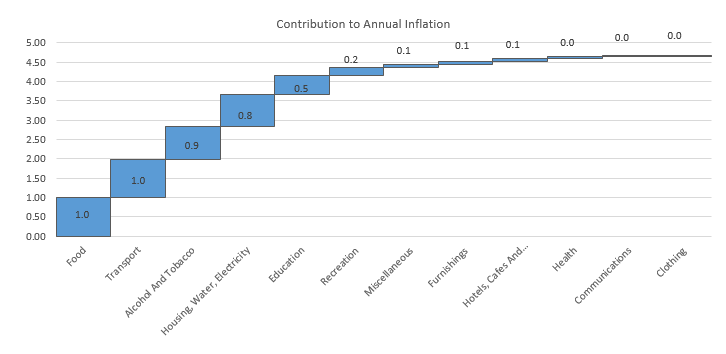
Alcoholic beverages and tobacco prices, making up approximately 12.6% of the overall inflation basket, was the third highest contributor to the annual inflation rate in January. Accelerated increases in the prices for both the alcohol and tobacco sub-categories were observed in January, with alcohol prices increasing by 6.7% y/y and tobacco prices increasing by 5.3% y/y.
The Housing and utilities category bears the largest weighting in the CPI basket, but the year-on-year rate of price increases for this category has been slowing since November last year. Prices increased by 1.9% m/m for this category which is a result of annual rental adjustments being put through every January. Year-on-year, price increases slowed to 2.9% y/y in January (the lowest since December 2015) following a 3.1% y/y increase in December. Prices for the rental payments for dwellings sub-category increased by 2.3% y/y in January while prices for regular maintenance and repairs increased by 3.3% y/y. Price increases in the electricity, gas and other fuels subcategory were relatively muted at 4.8% y/y compared to 4.9% y/y in December.
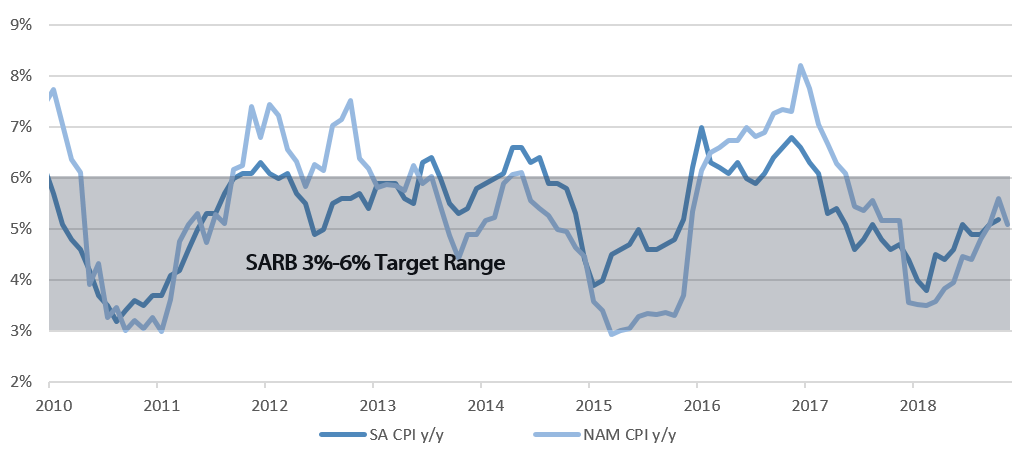
Easing fuel pump prices continue to afford the Namibian consumer some relief and can be seen in the Namibian annual inflation rate moderating from 5.1% y/y to 4.7% y/y in January. Although slightly higher than in December, lower oil prices have contributed towards curbing rising inflation. However, risks to the inflation outlook exist. Food inflation, which was the highest contributing basket item in January, could continue to rise at an accelerated pace as poor rainfall since the start of Namibia’s rainy season (ending in April) affects local food production. The resultant shortfall will necessitate an increase in imports that will lead to higher food inflation. Increased uncertainty in food security is most likely to offset any gains from easing transport inflation.
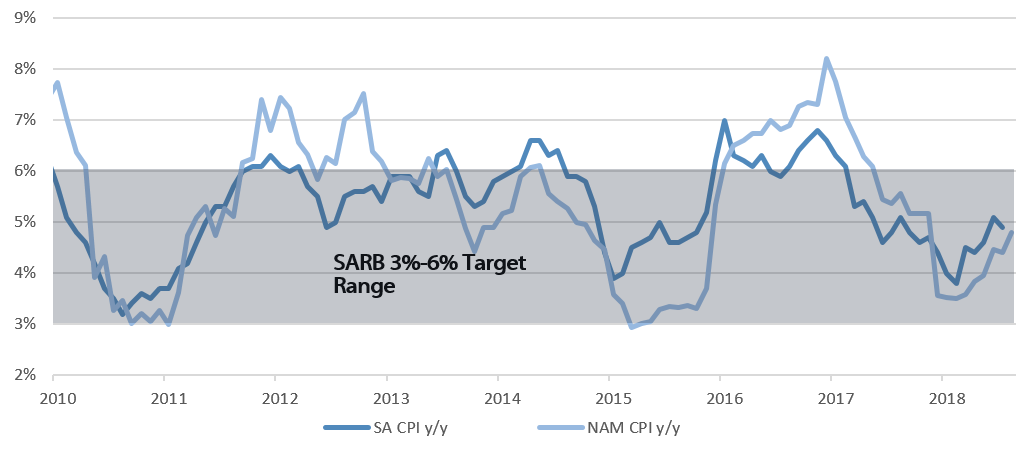
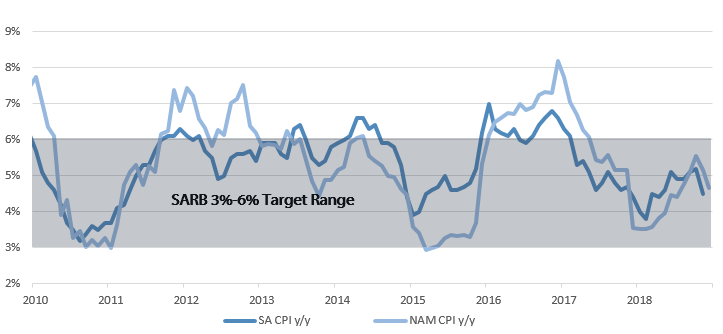
The Bank of Namibia (BoN) recently left rates unchanged when the MPC met on the 13th of February. In its policy statement, the BoN estimates that inflation will average 5.6% in 2019. Significantly higher than the 4.3% that annual inflation averaged in 2018, and likely hinged on a probable rise in food inflation. However, the BoN’s policy decisions are driven by the level of international reserves which the BoN currently estimates sufficient, at 4.2 months of import cover, to protect the currency peg with the rand. The BoN will remain mindful of the SARB’s rate path in 2019, with SA inflation expectations being the key focus of the SARB. SA inflation is expected to be contained well within the SARB’s 3% – 6% target band, pushing the likelihood of steady interest rates for 2019 increasingly higher. This would allow the BoN to keep monetary policy accommodative for as long as the SARB does the same.