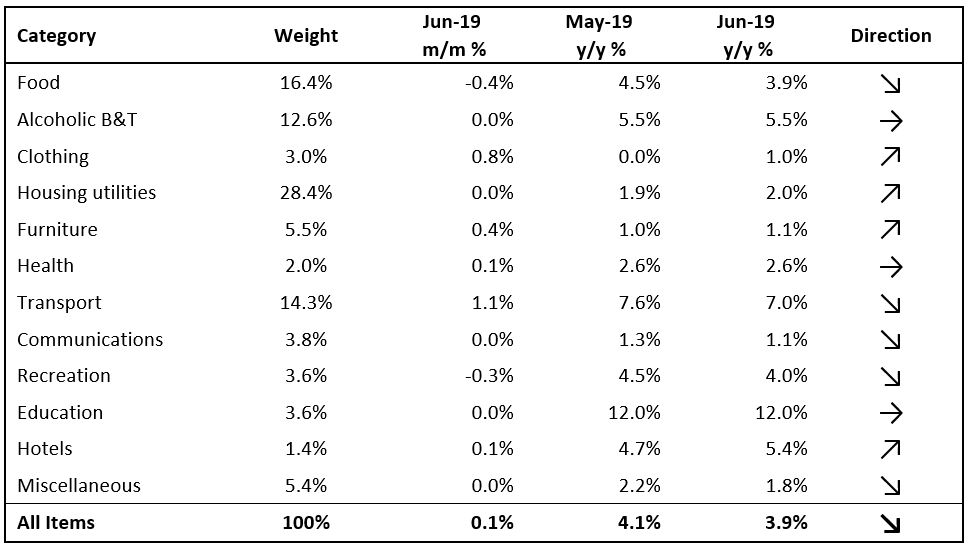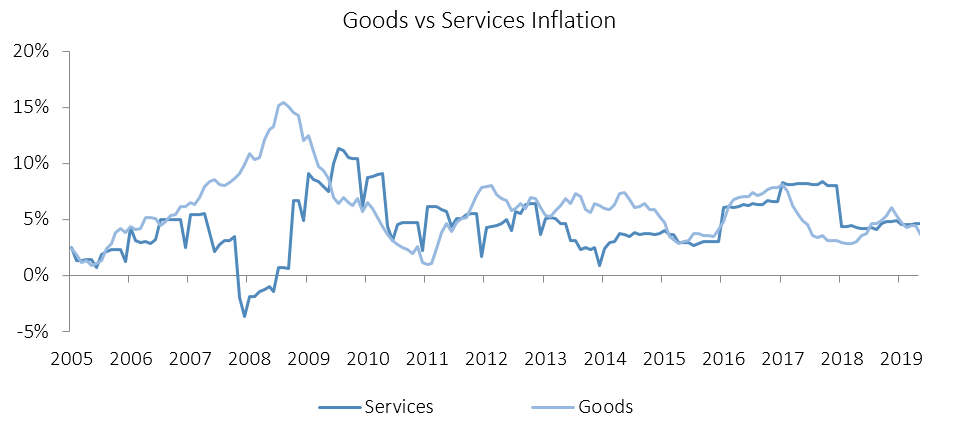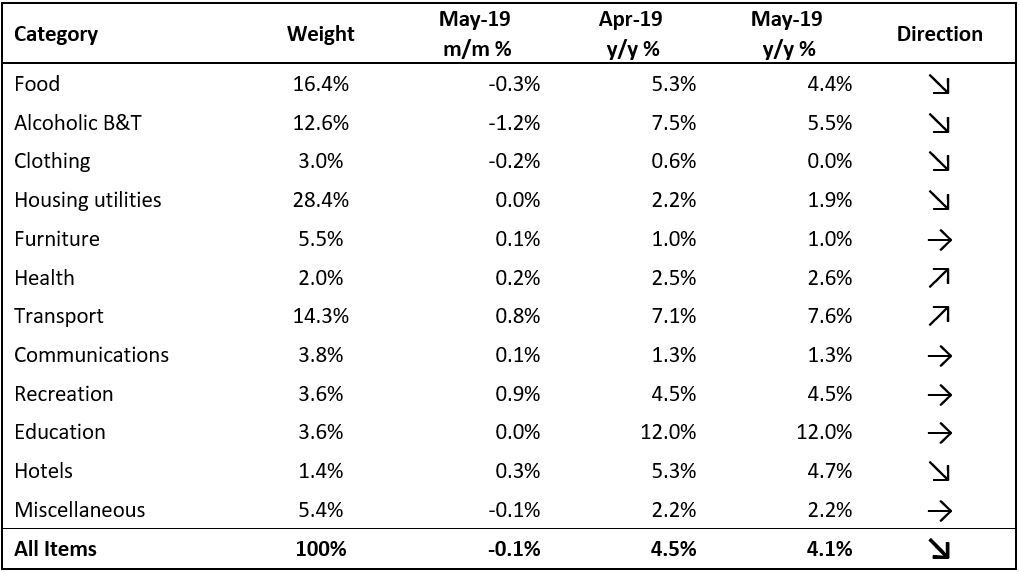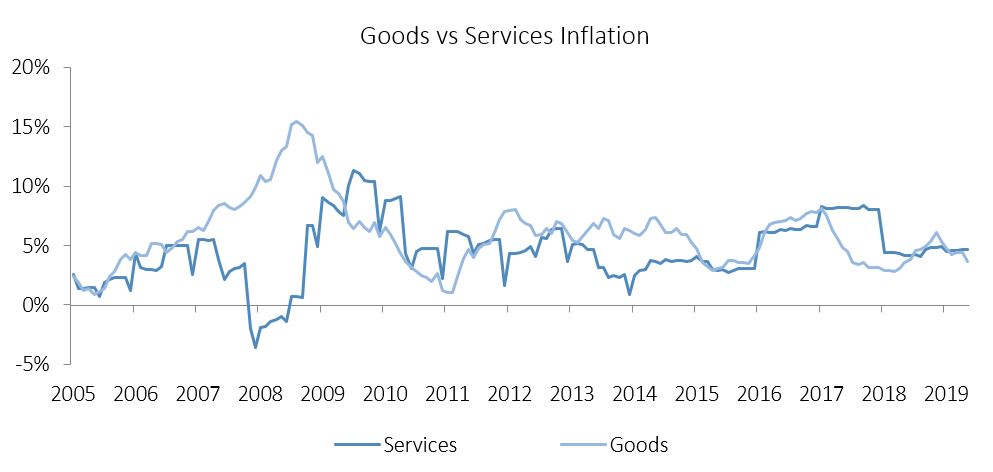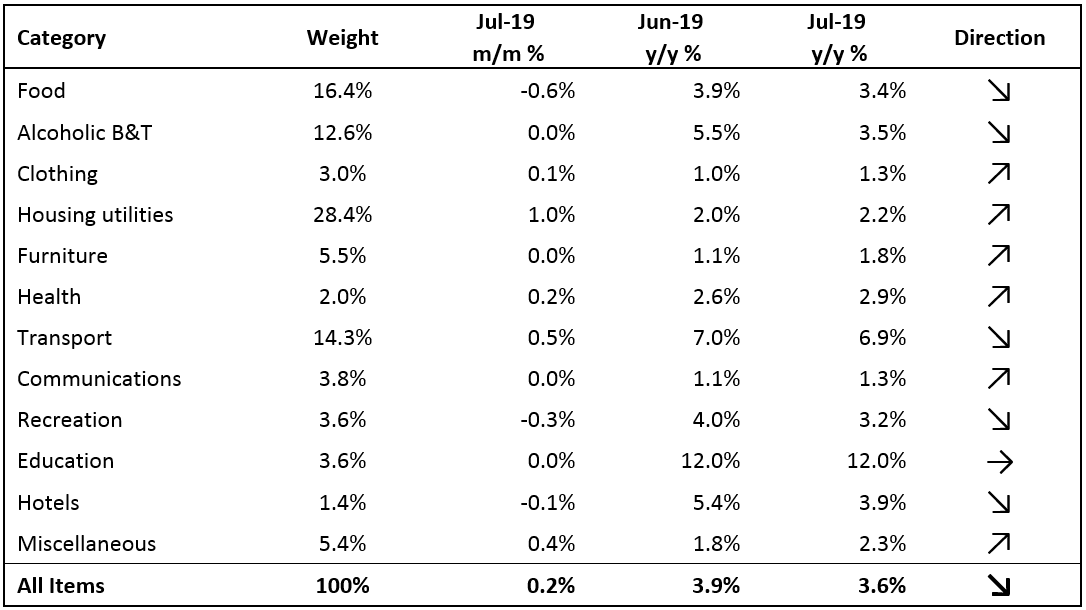
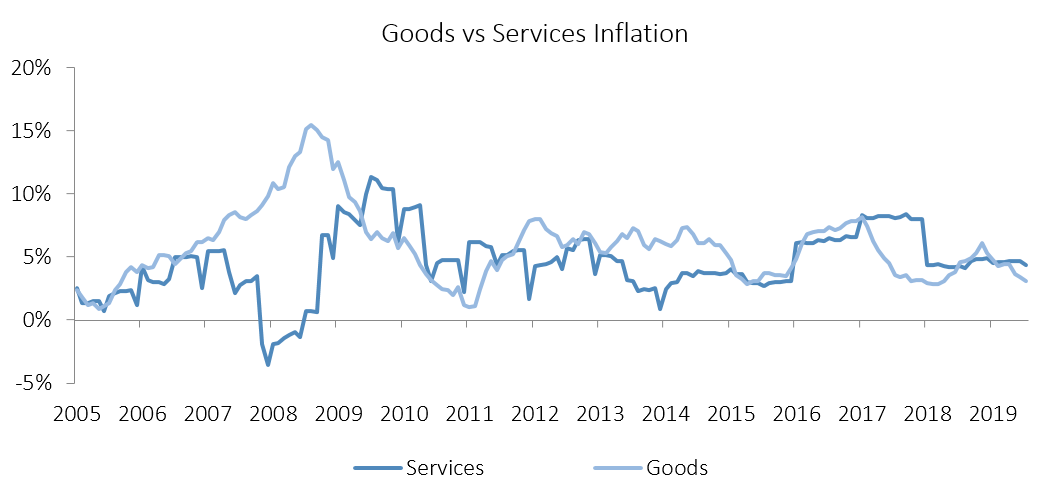
The Namibian annual inflation rate slowed to 3.6% y/y in July, following the 3.9% y/y increase in prices recorded in June. Prices increased by 0.2% m/m, compared to the overall basket price increase of 0.1% m/m in June. Overall, prices in six of the basket categories rose at a faster annual rate than in July, prices in five categories rose at a slower annual rate and one category recorded steady inflation rates. Prices for goods rose by 3.1% y/y while prices for services rose by 4.4%.
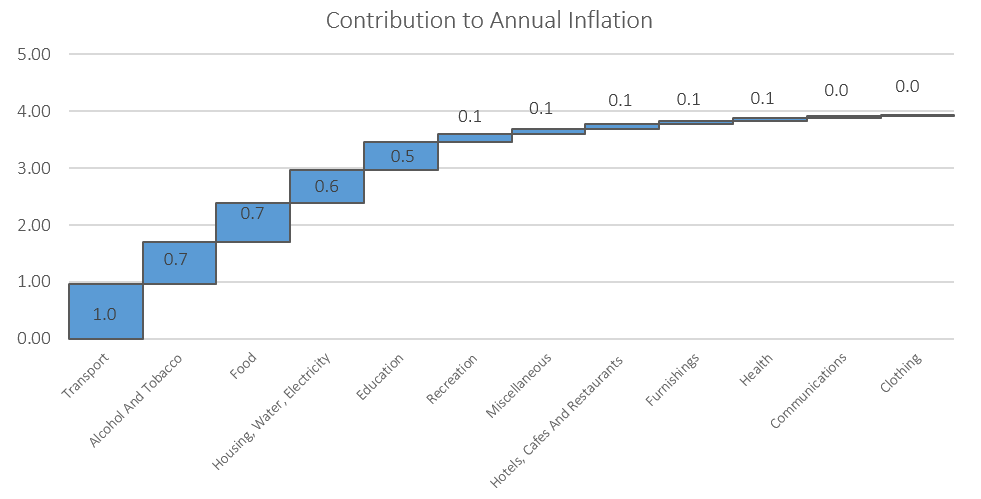
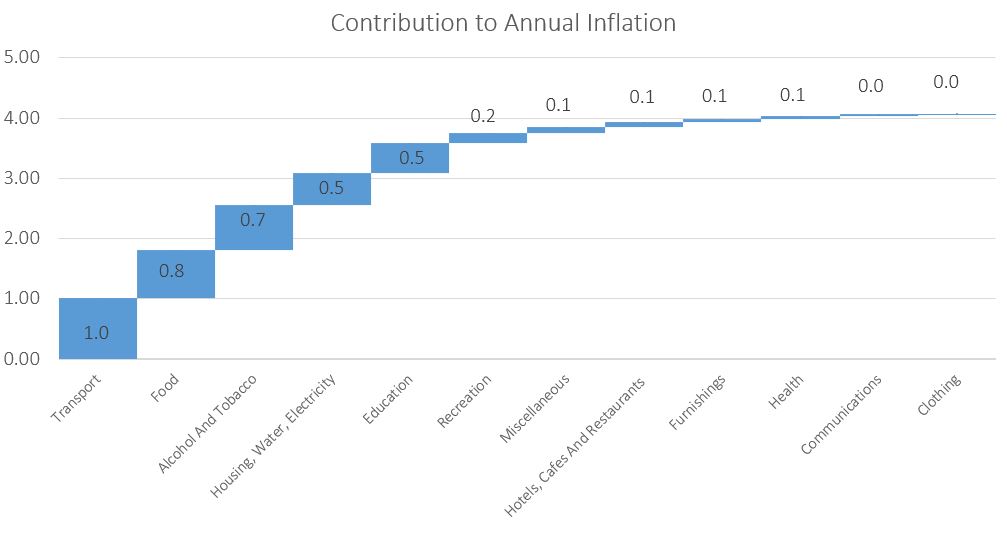
Transport accounted for 0.9% of the total 3.6% annual inflation recorded in July, making it the largest contributor to annual inflation for the month. Prices for the transport basket rose 0.5% m/m and 6.9% y/y during the month. The purchase of vehicles subcategory saw price increases of 0.6% m/m and 3.6% y/y in July, while the operation of transport equipment subcategory recorded price increases of 0.7% m/m and 4.9% y/y. Although global oil prices have declined in the last few months, the Ministry of Mines and Energy decided to keep fuel pump prices unchanged for July in order to strengthen its financial capacity to subsidise possible under-recoveries in future.
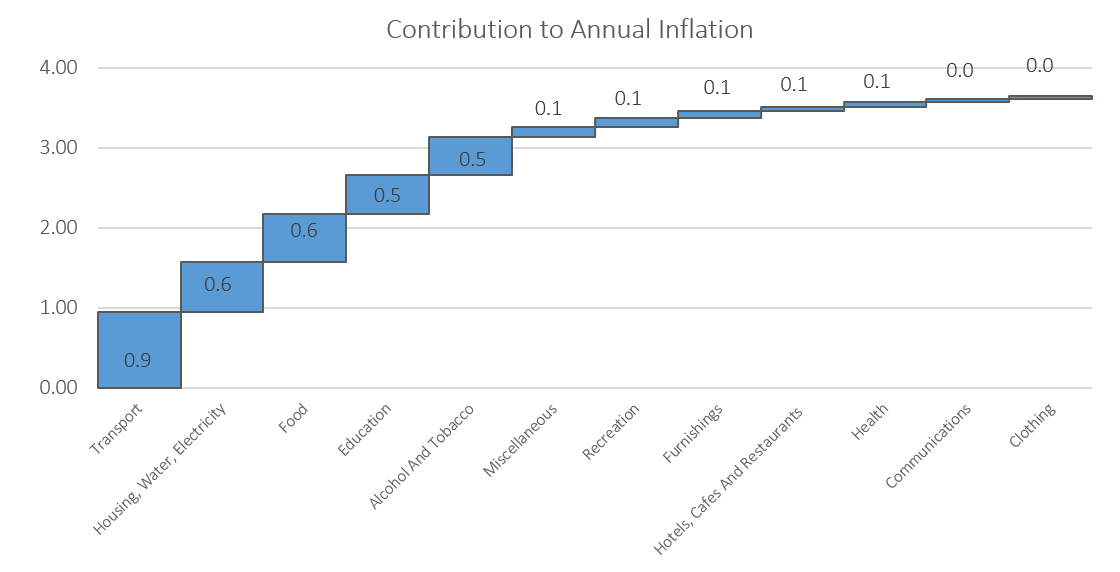
The Housing and utilities category, the largest weighting in the CPI basket, was the second largest contributor to annual inflation, accounting for 0.6% of the 3.6% annual inflation rate. Housing and utility costs increased by 1.0% m/m and 2.2% y/y. The upward movement on a month-on-month basis resulted from an increase in prices for the electricity, gas and other fuels sub-component. Prices of this subcategory rose 5.6% m/m and 1.6% y/y. Water supply, sewage service and refuse collection recorded an increase of 2.2% m/m as a result of the 5% increase in water tariffs effective from 1 July 2019, announced by the City of Windhoek.
Food & non-alcoholic beverages, the second largest basket item by weighting, was the third largest contributor to annual inflation, accounting for 0.6% of the 3.6% annual inflation rate. Prices in this category decreased by 0.6% m/m, but increased by 3.4% y/y. Prices in nine of the thirteen sub-categories recorded increases on annual basis, with the largest increases being observed in the prices of fruits, sugar and confectionaries and vegetables.
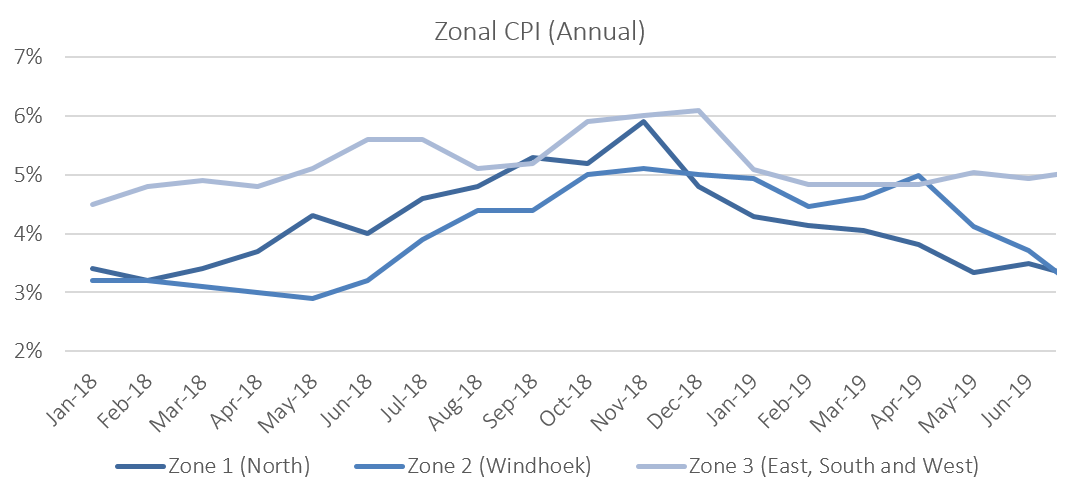
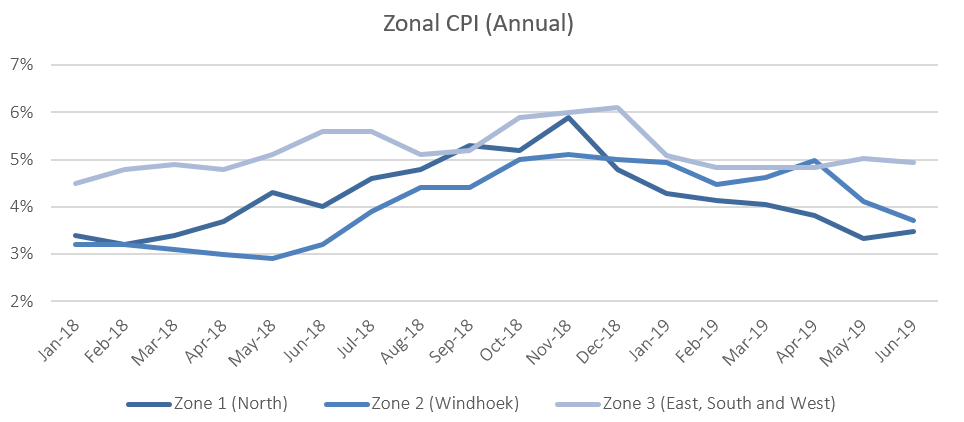
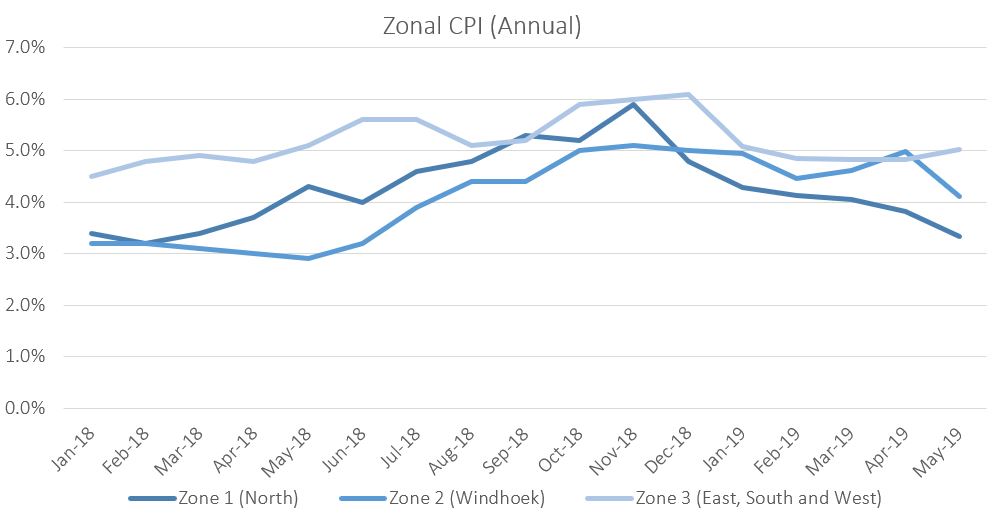
Zonal data shows that on a monthly basis prices declined by 0.1% in the central zone 2 while rising elsewhere in the country. On an annual basis the Windhoek and surrounding area, in zone 2, recorded the lowest inflation rate at 3.0% in July, with the mixed zone 3 covering the south, east and west of the country recording the highest rate of inflation at 5.1% y/y. Inflation in zone 1 (Northern region) moderated to 3.2% y/y.
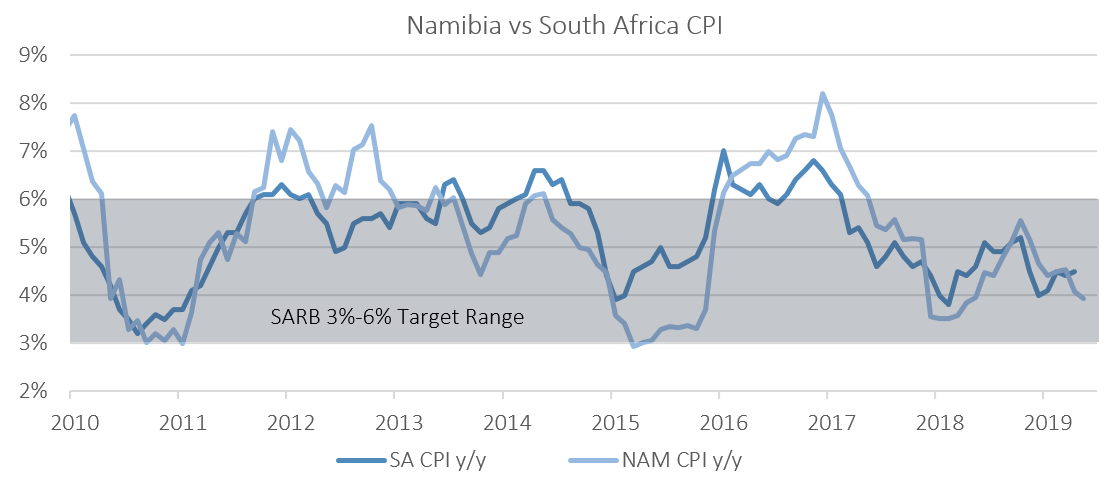
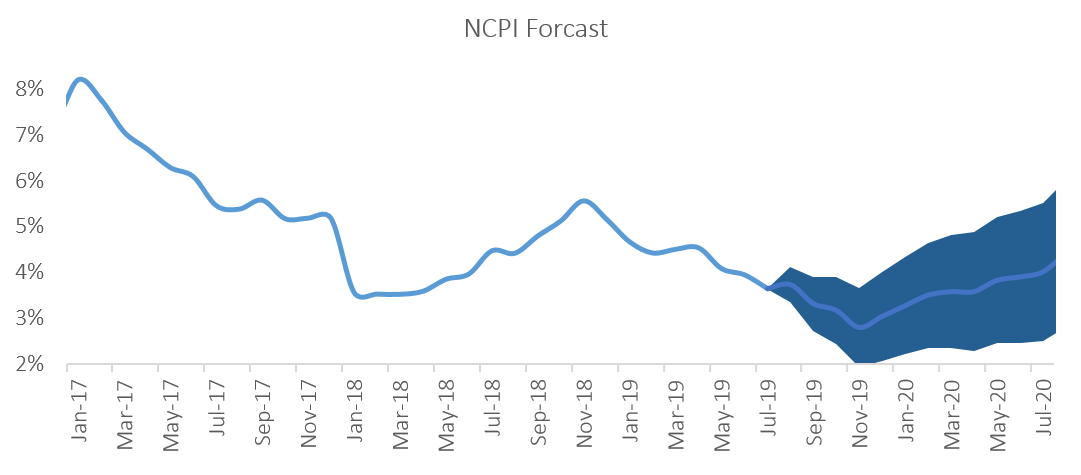
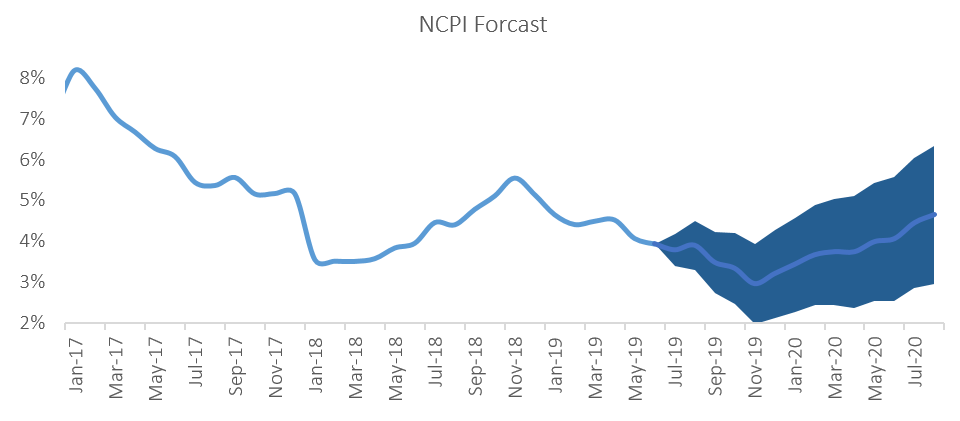
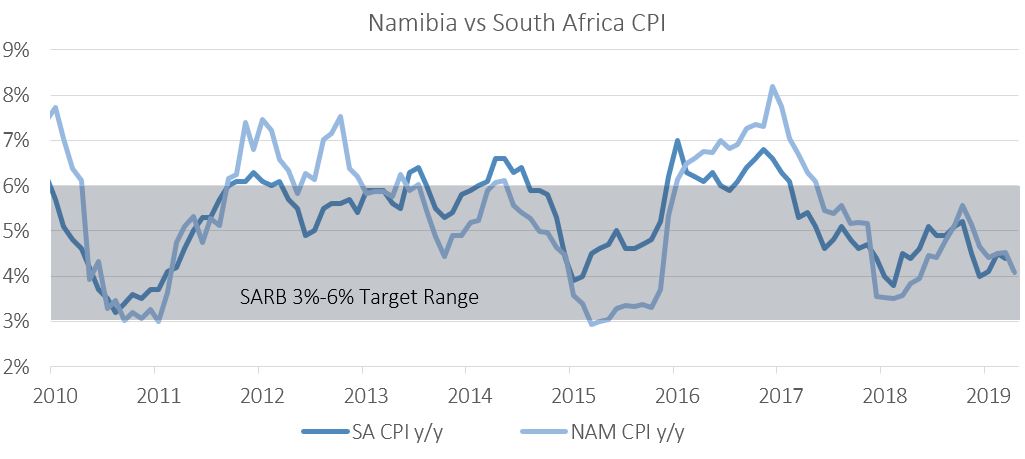
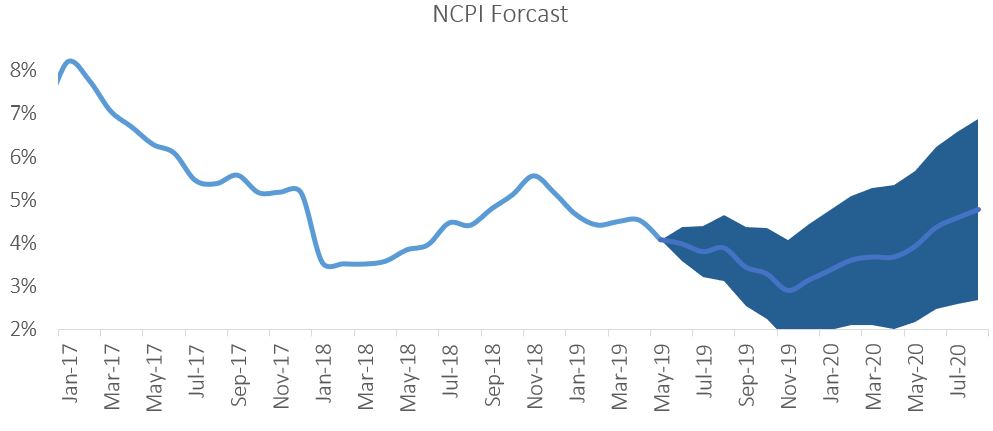
The Namibian annual inflation rate of 3.6% y/y continues trending lower than neighbouring South Africa’s June figure of 4.5%. As the Namibian economy is projected to remain weak in 2019, coupled with slowing inflation since the beginning of the year, the Bank of Namibia (BoN) has this week taken the decision to cut the repo rate by 25 basis points to 6.50%. IJG’s inflation model forecasts an average inflation of 3.8% y/y in 2019. The largest upside risk to this forecast is higher transport and food costs.