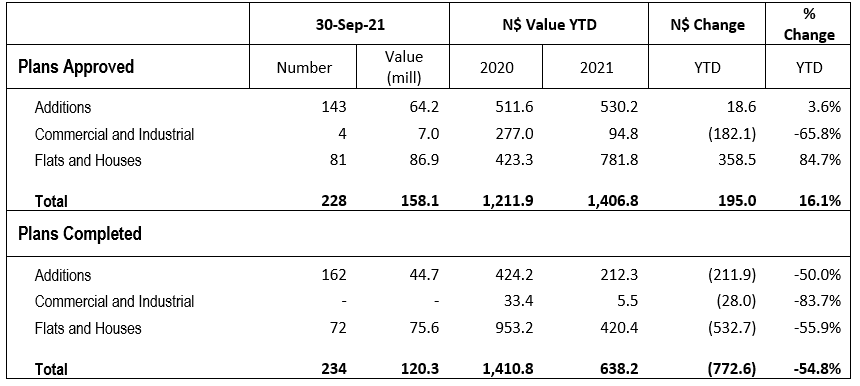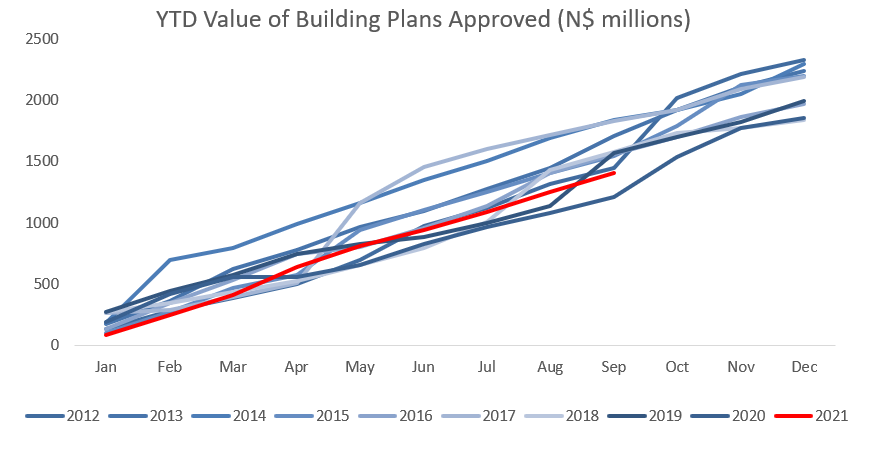
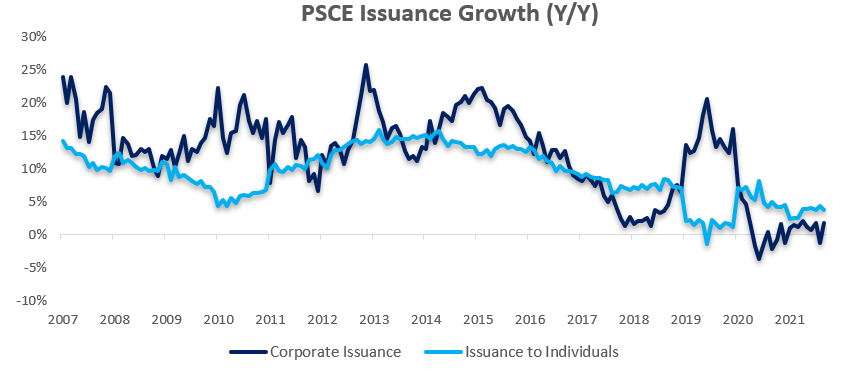
Overall
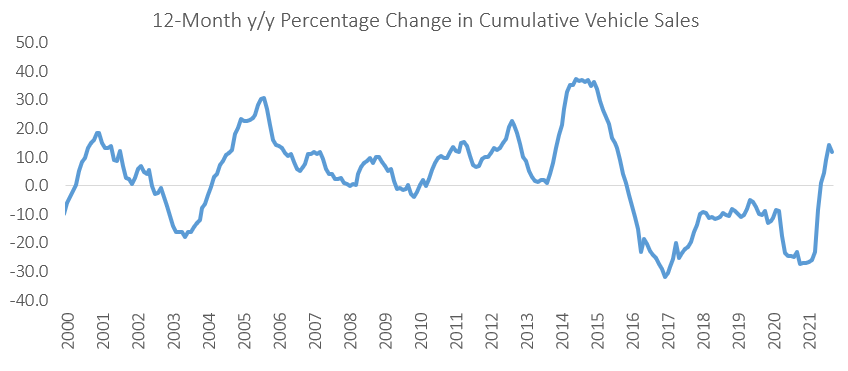
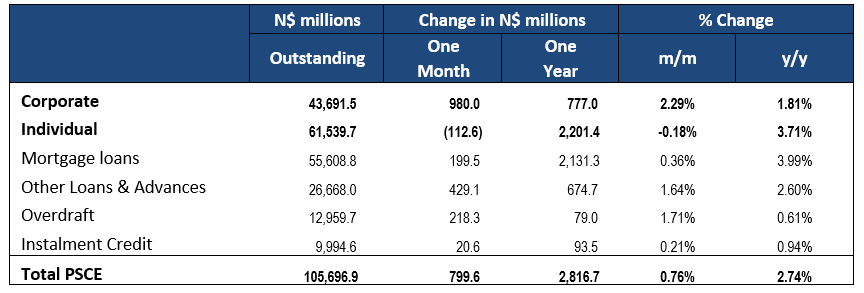
Private sector credit (PSCE) increased by N$799.6 million or 0.76% m/m in September. PSCE grew by 2.74% y/y in September, up from August’s increase of 1.85% y/y. On a 12-month cumulative basis, N$2.82 billion worth of credit was extended to the private sector. This represents an 89.9% y/y increase from last September’s 12-month cumulative issuance figure. This increase is due to base effects and does not indicate meaningful, above-trend growth in PSCE. Instead, PSCE growth has remained relatively stable, recording around 2.2% y/y growth over the past few months after faltering for much of 2020, hence the intermittent large year-on-year increases. Individuals continue to take up the majority of this cumulative issuance.
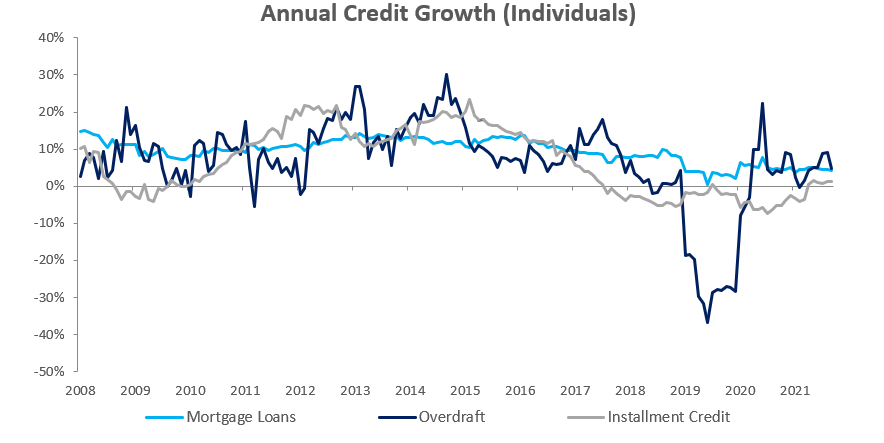
Credit Extension to Individuals
Credit extended to individuals decreased by 0.18% m/m but increased by 3.71% y/y in September. On a month-on-month basis, only one sub-category of loans and advances increased, namely mortgage loans by 0.1% m/m. The other two subcategories of loans and advances; namely other loans & advances and overdraft, shrunk in September by 0.7% m/m and 3.2% m/m respectively. Instalment credit grew by 0.2% m/m. On a year-on-year basis all subcategories of loans & advances, and instalment credit registered increases in September. Specifically, mortgage loans increased by 4.3% y/y, other loans & advances increased by 2.3% y/y and overdrafts grew by 4.8% y/y. Instalment credit issued to individuals grew by 1.3% y/y in September, marking the sixth straight month of year-on-year increases in this category. Prior to this streak, instalment credit shrunk year-on-year for the previous 20 months (back to August 2019). Despite structurally making up only 10-12% of the total credit extended to individuals, this sustained up-tick in instalment credit is perhaps an indicator of improving consumer demand. But again, this is a minor increase in a minor category and overall growth of credit extended to individuals remains sluggish.
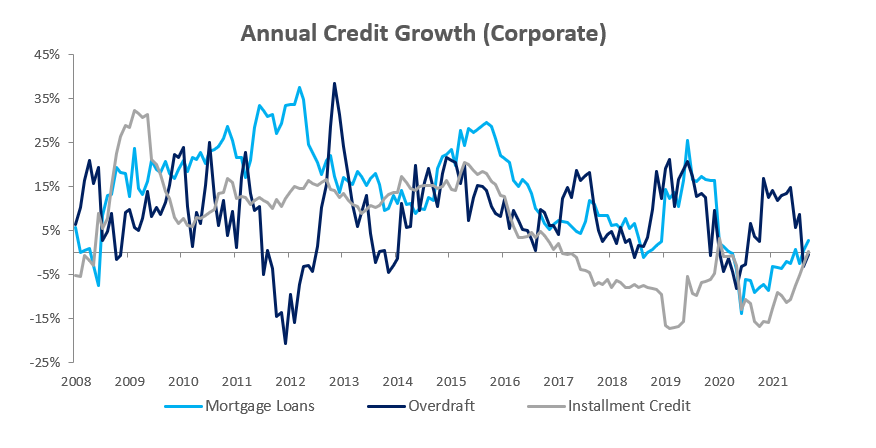
Credit Extension to Corporates
Credit extended to corporates grew by 2.29% m/m and 1.81% y/y in September. Total corporate loans & advances grew by 2.0% y/y in September, driven by increases in mortgage loans as well as other loans & advances with both sub-categories recording growth of 2.8% y/y. Overdrafts decreased by 0.3% y/y and instalment credit grew by 0.2% y/y. The month-on-month increase in corporate credit extensions was particularly strong in September, with the 2.29% m/m increase representing the largest month-on-month increase in 2021. This is due partially to base effects as August saw one of 2021’s largest month-on-month decreases in credit extensions to corporates.
Banking Sector Liquidity
The overall liquidity position of Namibia’s commercial banks decreased in September, falling by N$398.3 million to an average of N$1.40 billion. The BoN attributes this to government borrowing activities resulting from a large September bond auction. Despite the decrease in liquidity, the total balance of repos outstanding decreased during September. The repo balance fell to N$907.7 million at the end of September after starting at N$1.27 billion.

Reserves and Money Supply
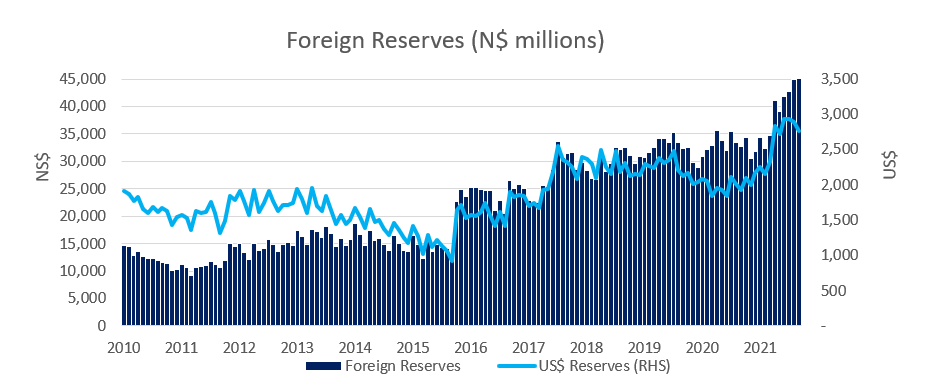
Broad Money Supply (M2) contracted by N$2.93 billion or 2.3% y/y in September, according to the BoN’s latest monetary statistics. The money supply also decreased by 0.1% m/m and now stands at N$122.9 billion compared to the N$123.1 billion at the end of August. The BoN made a significant revision to the international reserve balance for the month of August in the latest data. Previously the stock of international reserves was seen to decrease by 4.1 % m/m in August to N$40.9 billion. As per the latest data, the stock of international reserves for August instead increased to N$44.9 billion. Using this revised estimate, the BoN’s stock of international reserves rose by 2.1% m/m to N$45.9 billion in September. While the wording is unclear, the Bank of Namibia has attributed the increased level of international reserves (read – the August adjustment) to the IMF’s allocation of Special Drawing Rights (SDR) in August.
Outlook
PSCE growth in September remained subdued and broadly in line with the 2021 trend. We expect the Bank of Namibia’s MPC to keep interest rates at their current level for the remainder of the year, but pressure is growing on the South African Reserve Bank to increase interest rates. This is because inflation is hovering around the 5.0% mark, and with inflation risks to the upside, the SARB may need to hike rates to keep inflation below their 6% y/y targeted upper-bound. The SARB’s MPC meets on 18 November with a rate hike looking more likely than at any other point in the year so far. Should the SARB raise rates, the BoN will surely follow. While this will likely have a negative impact on PSCE, there is argument to be made that because PSCE growth has been, and remains, so subdued that perhaps a rate hike won’t make all that much difference.