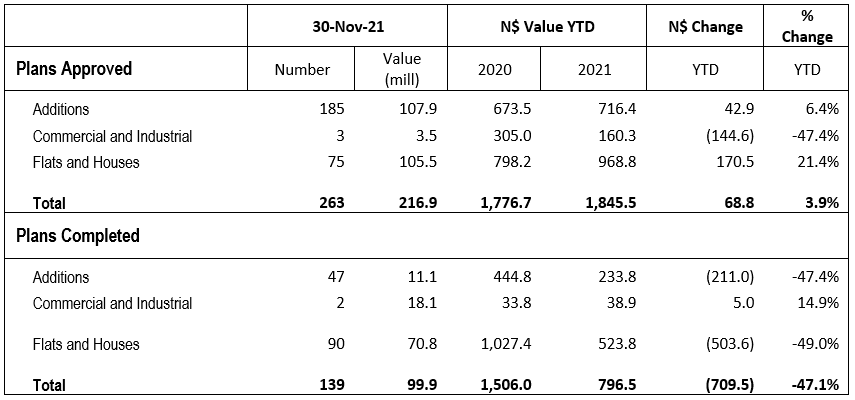
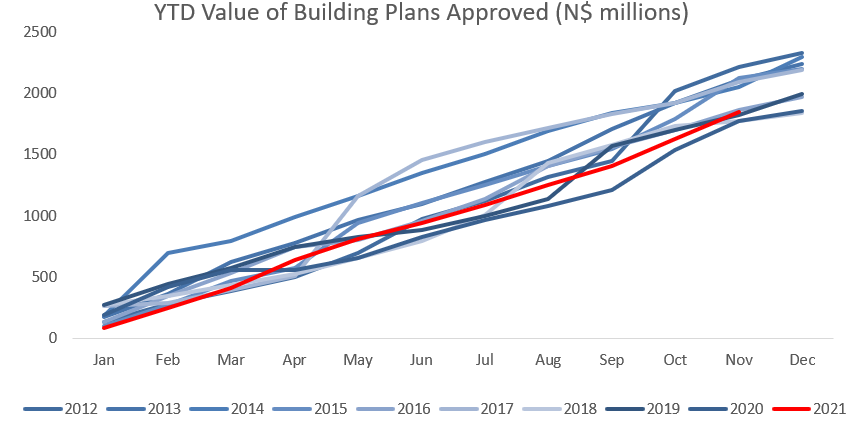
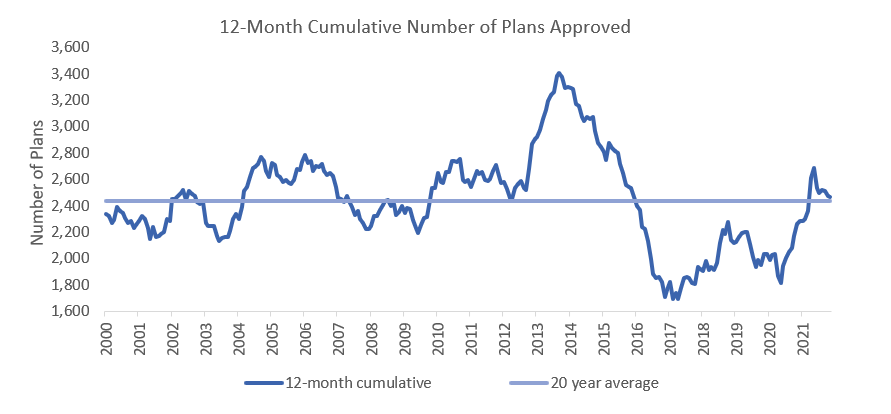
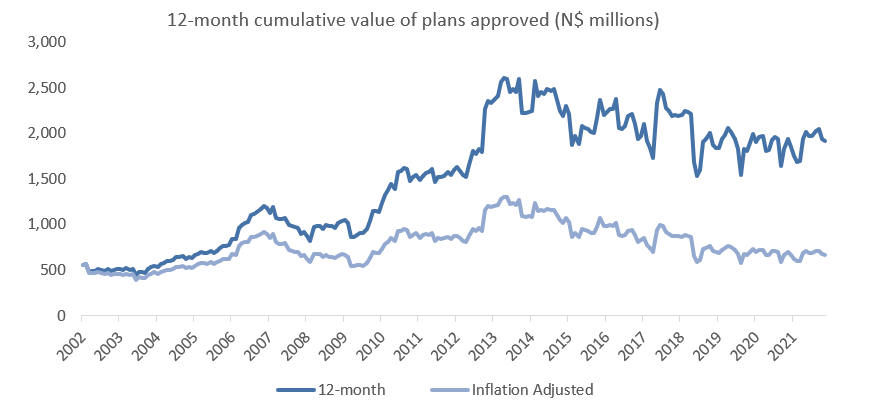
In November the City of Windhoek approved 263 building plans, a 3.0% m/m decrease from the 271 approved in October. The total value of approvals decreased by 2.1% m/m to N$216.9 million. On a 12-month cumulative basis, the number of approvals has risen by 9.3% y/y to 2,468 but the value of these approvals has declined by 1.1% y/y to N$1.92 billion. Year-to-date there have been 2,353 approvals valued at N$1.85 billion. 139 construction projects were completed in November at a value of N$99.9 million. In terms of value, this equates to a 147.1% y/y increase and a 71.0% m/m increase. However, on a 12-month cumulative basis the value of completed projects is down 46.3% y/y.
185 additions to properties were approved at a value of N$107.9 million in November, making November the best month, in terms of value, for addition approvals in 2021. This represents a 12.1% y/y increase in number and 13.5% y/y increase in value. Month-on-month this translates to a 7.5% decrease in number but a 37.9% increase in value. 47 additions to properties were completed in November at a value of N$11.1 million. The latter months of 2020 saw a particularly slow rate of construction completions, therefore the year-on-year change in the value of additions completed has doubled (approximately 101.1% y/y increase in value). On a year-to-date basis, the number of additions to properties completed stands at 855, at a value of N$233.8 million. While the number of additions completed by this time last year is similar (866 by November 2020) the value of those additions stood significantly higher, at N$444.8 million.
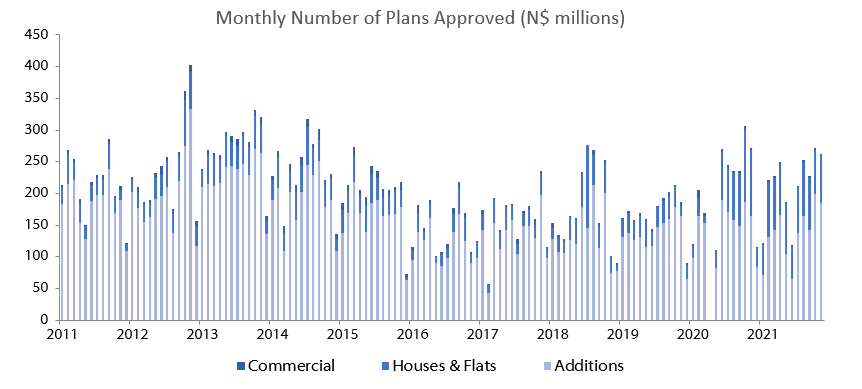
75 residential units were approved in November at a value of N$105.5 million, translating to an 8.7% m/m increase in number and a 29.6% m/m increase in value. Year-to-date 808 units have been approved at a value of N$968.8 million. These numbers compare favourably to last November’s year-to-date figures when only 610 residential units were approved at a value of N$798.2 million. Accordingly, on a 12-month cumulative basis, the value of residential approvals increased by 9.3% y/y and the number of approvals by 7.9% y/y. 90 residential units were completed in November at a value of N$70.8 million, making November the best month for the number of residential unit completions in 2021. On a 12-month cumulative basis the number of residential properties completed now stands at 596, with a collective value of N$540.6 million. Following the trend seen in completions of additions to properties, the 12-month cumulative value figure for residential units completed has fallen by 46.3% y/y.
In November three commercial units with a combined value of N$3.5 million were approved. Year-to-date 34 commercial units worth N$160.3 million have been approved. In terms of value, that’s 47.4% lower than at the same time last year. Two commercial units were completed in November at a value of N$18.1 million. After six consecutive months with zero completions Windhoek has now seen back-to-back months with commercial completions, the first time that has happened in 2021. Encouragingly, this means that the year-to-date value of commercial construction projects completed is higher now than it was at the same time in 2020.
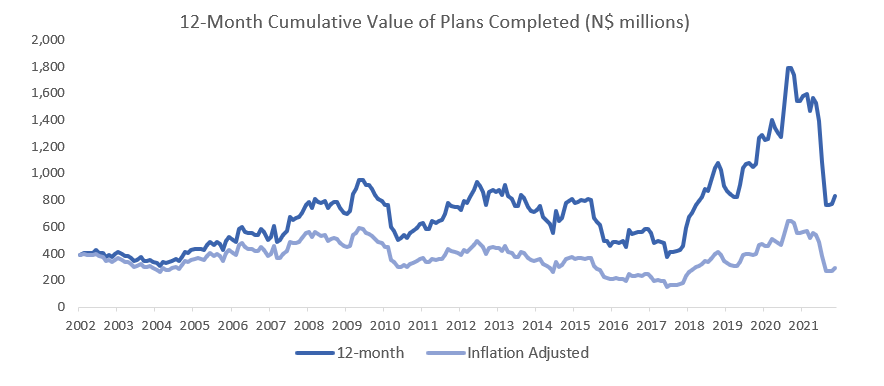
On a 12-month cumulative basis, the number of building plans completed fell by 8.3% y/y and by 46.3% y/y in terms of value. Given the severity of the general economic contraction in the past 18 months this is not surprising. The year-on-year change of the 12-month cumulative value of plans completed is therefore likely to remain negative for several more months.
As the year draws to a close, we now have a sufficiently detailed picture of how well the construction industry faired in 2021. In a phrase, 2021 was not all that bad. The year-to-date figure for total building plan approvals stands at N$1.85 billion, that’s a 3.9% y/y increase from the N$1.78 billion approved by last November. The success and rate with which these approvals are converted into completions will go a long way to determining the fortunes of the construction sector in 2022. While the year-to-date value of total building completions remains well off 2020 levels, in the context of the last five years the figure (N$796.5 million y-t-d completions by November 2021) doesn’t look out of place (5-year November average; N$913.8 million).