NCPI – August 2020

The Namibian annual inflation rate ticked up slightly to 2.4% y/y in August, following the 2.1% y/y increase in prices recorded in July. Prices in the overall NCPI basket increased by 0.4% m/m. On a year-on-year basis, overall prices in four of the twelve basket categories rose at a quicker rate in August than in July, with six categories recording slower rates of inflation and two categories recording increases consistent with the prior month. Prices for goods increased by 3.1% y/y while prices for services rose 1.5% y/y.

The food & non-alcoholic beverages category was the largest contributor to annual inflation in August, accounting for 1.2 percentage points of the total 2.4% annual inflation rate. The category recorded price increases of 1.2% m/m and 6.8% y/y. Prices in all thirteen sub-categories recorded increases on a year-on-year basis. The largest increases were observed in the prices of fruits which increased by 18.1% y/y and vegetables which increased by 12.3% y/y. The prices of meat products recorded a somewhat slower increase in prices at 9.9% y/y after seven consecutive months of faster increases on an annual basis. The rate of increase for this sub-category remains relatively elevated compared to average inflation of 2.8% over the last 12 months. On a monthly basis, the bread and cereals category recorded the highest inflation at 2.0% m/m, followed by fish which recorded an increase of 1.7% m/m.

Alcoholic beverages and tobacco prices, making up approximately 12.6 of the overall inflation basket, was the second highest contributor to the annual inflation rate in August, with prices of the basket item increasing by 3.6% y/y. On a month-on-month basis prices of the basket item fell by 0.7% m/m. Prices for alcoholic beverages fell by 0.8% m/m, but rose 3.4% y/y, while tobacco prices increased by 0.3% m/m and 4.7% y/y.

The education basket recorded inflation of 7.0% y/y, with the cost of pre-primary education growing at a rate of 5.6%. Primary and secondary education recorded price increases of 9.3% y/y, while tertiary education prices rose by 5.3% y/y. None of the three subcategories printed price increases on a month-on-month basis.

The NSA’s regional CPI data shows that on a monthly basis prices increased by 0.5% in the northern zone 1, 0.4% in the central zone and 0.3% in the mixed eastern, southern and western zone. On an annual basis the Windhoek and surrounding area, in zone 2, recorded the highest inflation rate at 2.9% y/y in August, with the mixed zone 3 recording the lowest rate of annual inflation at 1.5% y/y. Inflation in the northern region ticked up to 2.5% y/y.

As expected, the Namibian inflation rate recorded a slight uptick to 2.4% y/y in August. Inflationary pressure thus remains weak and continues to trend below South African inflation. The main driver of inflation in the last couple of months has been food inflation which has been averaging 4.3% y/y since the beginning of the year. The increase in fuel pump prices in August had a rather muted effect on overall inflation as fuel prices still remain lower than at the same time last year. 

IJG’s inflation model forecasts an average inflation rate of 2.3% y/y in 2020 and 3.8% y/y in 2021. The biggest risk to our inflation forecast is global oil prices, although a large increase in prices seems unlikely at this point seeing that OPEC had again revised its forecast for global oil demand down by another 400,000 barrels per day to 90.2 million barrels per day. We do not expect landlords to push up rental prices any time soon either as many consumers will not be able to afford it and landlords will want to keep vacancies to a minimum. With these being the larger categories of the inflation basket, we thus do not foresee any sudden increases in Namibian inflation in the short-term.

New Vehicle Sales – August 2020

593 New vehicles were sold in August, an 11.0% m/m contraction from the 666 vehicles sold in July, and a 26.6% y/y decline from the 808 new vehicles sold in August 2019. Year-to-date 4,776 vehicles have been sold of which 1,962 were passenger vehicles, 2,479 were light commercial vehicles, and 218 were were medium and heavy commercial vehicles. On an annual basis, twelve-month cumulative new vehicle sales continued on a downward trend with 8,142 new vehicles sold over the last twelve months, a 25.0% y/y contraction from the corresponding period last year.

A total of 205 new passenger vehicles were sold during August, representing a 9.7% m/m and 43.1% y/y contraction. Year-to-date passenger vehicle sales rose to 1,962 units, down 39.0% when compared to the year-to-date figure recorded in August 2019. On a rolling 12-month basis, passenger vehicle sales are at their lowest level since July 2004, highlighting the severity of the slowdown in sales.

Commercial vehicles sales reflect a similar picture, declining by 26.4% year-to-date and 21.7% y/y on a rolling 12-month basis. 388 New commercial vehicles were sold in August, a contraction of 11.6% m/m and 13.4% y/y. 323 Light commercial vehicles, 21 medium commercial vehicles, and 44 heavy and extra heavy commercial vehicles were sold during the month. On a twelve-month cumulative basis, light commercial vehicle sales dropped by 23.1% y/y, medium commercial vehicle sales fell 11.8% y/y, and heavy commercial vehicle sales contracted by 10.2% y/y. 

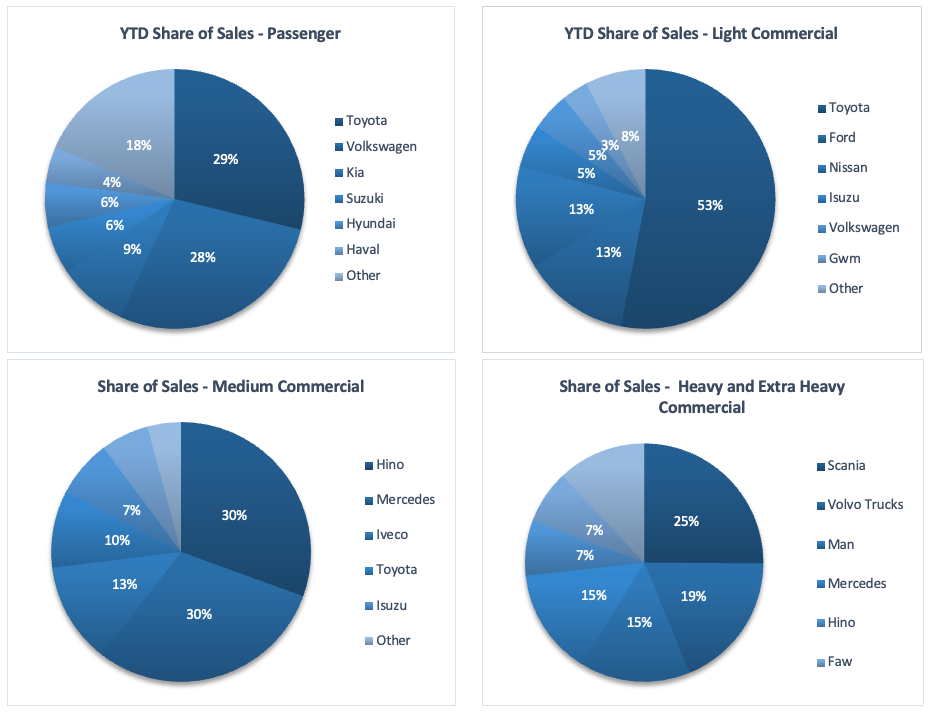
During the month, Toyota retook the lead from Volkswagen in terms of year-to-date market share of new passenger vehicles sold. Toyota claimed 28.7% of the market, followed closely by Volkswagen with 28.3% of the market. They were followed by Kia and Hyundai with 6.5% and 6.0% of the market respectively, while the rest of the passenger vehicle market was shared by several other competitors.

Toyota remained the leader in the light commercial vehicle space with a robust 57.2% market share, with Nissan in second place with a 12.7% share. Ford and Isuzu claimed 10.9% and 7.5%, respectively, of the number of light commercial vehicles sold thus far in 2020. Mercedes leads the medium commercial vehicle segment with 29.1% of sales year-to-date. Scania was number one in the heavy and extra-heavy commercial vehicle segment with 24.3% of the market share year-to-date.

The Bottom Line

The new vehicle sales figures show how badly economic activity has been hampered since the lockdowns were imposed. New vehicle sales are down considerably when compared to 2019, which by itself was a bad year for vehicle sales. We expect the current depressed trend in new vehicle sales to remain depressed for the medium term as there are currently very few catalysts for economic growth. It is unlikely that many businesses and consumers will be in a financial position to purchase new vehicles for the rest of the year.

Building Plans – August 2020

The City of Windhoek approved a total of 235 building plans in August, 10 fewer than in July. In value terms approvals fell by N$29.2 million to N$111.9 million, a 20.7% m/m and 17.4% y/y decrease. A total of 275 completions to the value of N$395.0 million were recorded in August, a rather substantial 183.5% y/y increase in number and 302.5% y/y in value. The year-to-date value of approved building plans reached N$1.08 billion, 5.0% lower than the comparative period a year ago. On a twelve-month cumulative basis, 2,049 building plans were approved worth approximately N$1.94 billion, 25.3% higher in value terms than approvals at the end of August 2019.

The majority of building plan approvals were made up of additions to properties. For the month of August 158 additions were approved worth N$64.0 million, 6.6% more in value terms than in July, although the number of additions approved fell by 7.6%% m/m. Year-to-date, 1,018 additions have been approved with a value of N$453.7 million, a 9.6% y/y decline in value terms. 118 additions worth N$28.7 million were completed during the month.

New residential units accounted for 76 of the total 235 approvals registered in August, 5 more than the 71 residential units approved in July. In monetary terms, N$33.0 million worth of residential units were approved in August, representing a 22.5% m/m and 54.4% y/y decrease. 306 New residential units have been approved thus far in 2020, 22.4% more than during the corresponding period in 2019. The year-to-date value of residential approvals reached N$348.5 million, 12.5% lower than during the same period in 2019. 156 new residential units worth N$353.8 million were completed during the month.

Only 1 new commercial unit, valued at N$15.0 million, was approved in August, bringing the year-to-date number of commercial and industrial approvals to 32, worth a total of N$276.0 million. On a rolling 12-month basis, the number of commercial and industrial approvals have slowed to 51 worth N$616.5 million as at August, representing an increase of 18.6% y/y in number terms and 89.9% y/y in value terms. It is important to note however that these increases are mostly attributable to base effects with a large approval in September 2019 contributing to the increases.

In the last 12 months 2,049 building plans have been approved, increasing by 5.8% y/y. These approvals were worth a combined N$1.94 billion, an increase in value of 25.3% y/y. While this sounds like a strong recovery, the increase is mostly as a result of base effects as a result of very little building activity in 2019. As the graph above shows, on an inflation-adjusted basis, the 12-month cumulative value of approvals is still going down steadily and currently trends at levels last seen in 2010.

The completions data also paints a particularly positive picture when judged at face value. Delving a bit deeper into the numbers however shows that 140 of the 275 completed buildings in August were at Omeya. In our opinion it is unlikely that such a high number of buildings were completed in the month, and could simply be due to the City of Windhoek catching up on its backlog.

Going forward we expect lower value additions to properties to continue making up the majority of approvals.