Overall
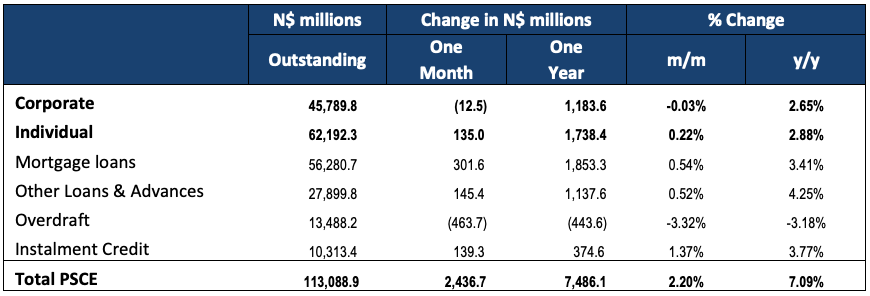
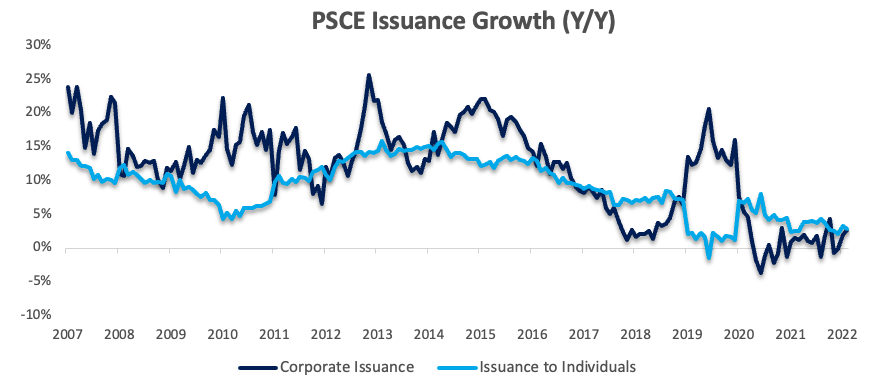
Private sector credit (PSCE) increased by N$2.44 billion or 2.2% m/m in February, bringing the cumulative credit outstanding to N$113.1 billion. On a year-on-year basis, private sector credit grew by 7.1% y/y in February, quicker than the already relatively high 4.8% y/y growth recorded in January. As was the case in January, the growth was primarily driven by a substantial increase of N$2.3 billion in claims on non-resident private sectors. On a 12-month cumulative basis N$7.47 billion worth of credit was extended to the private sector. Of this cumulative issuance, individuals took up N$1.74 billion, corporates increased their borrowings by N$1.18 billion and the non-resident private sectors took up N$4.56 billion.
Credit Extension to Individuals
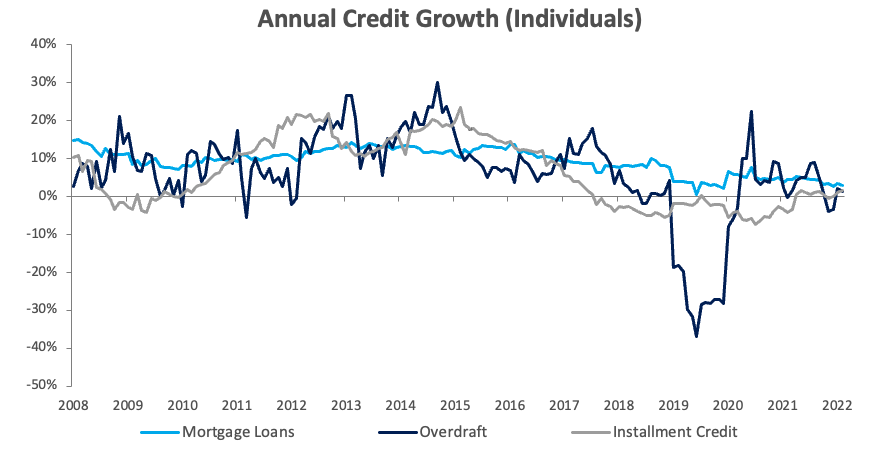
Credit extended to individuals increased by 0.2% m/m and 2.9% y/y in February. As was the case in January, most of the increase was driven by an increase in mortgage loans of 0.2% m/m and 2.9% y/y. Overdraft facilities to individuals fell by 0.5% m/m but rose 1.2% y/y, following the strong growth recorded in January. Other loans and advances (consisting of credit card debt, personal- and term loans) rose by 0.1% m/m and 4.0% y/y during the month.
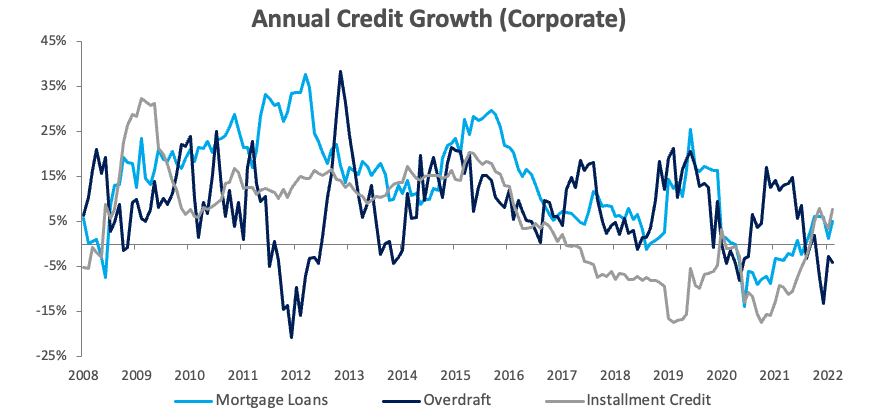
Credit Extension to Corporates
Credit extended to corporates remained steady in February, following the 3.5% m/m increase recorded in January. On a year-on-year basis, credit extended to corporates grew by 2.7% y/y, the quickest increase since October last year. Overdraft facilities to corporates erased some of the large increase recorded in January, falling by 3.9% m/m and 4.1% y/y. Mortgage loans increased by 1.5% m/m and 5.1% y/y, while instalment credit by corporates rose by 2.8% m/m and 7.8% y/y, albeit from a low base.
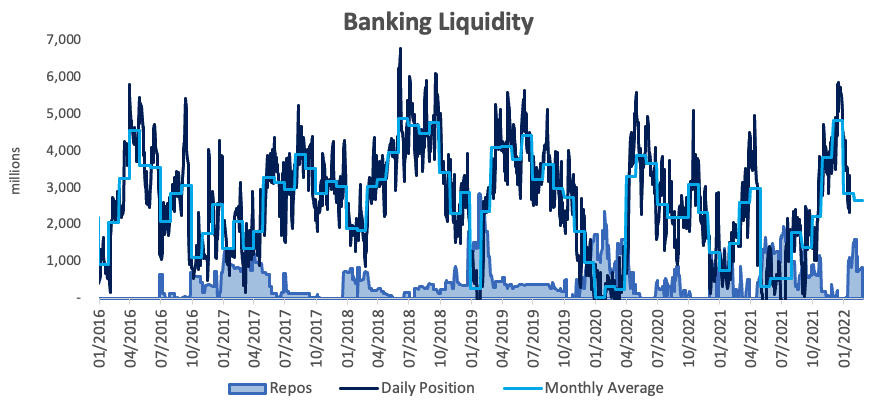
Banking Sector Liquidity
The overall liquidity position of the commercial banks deteriorated slightly during February, falling by N$179.0 million to an average of N$2.68 billion. The BoN ascribed the decline to “funds movement in search of better yields”. The repo balance fell to N$862.6 million at the end of the month after ending January at N$1.53 billion.
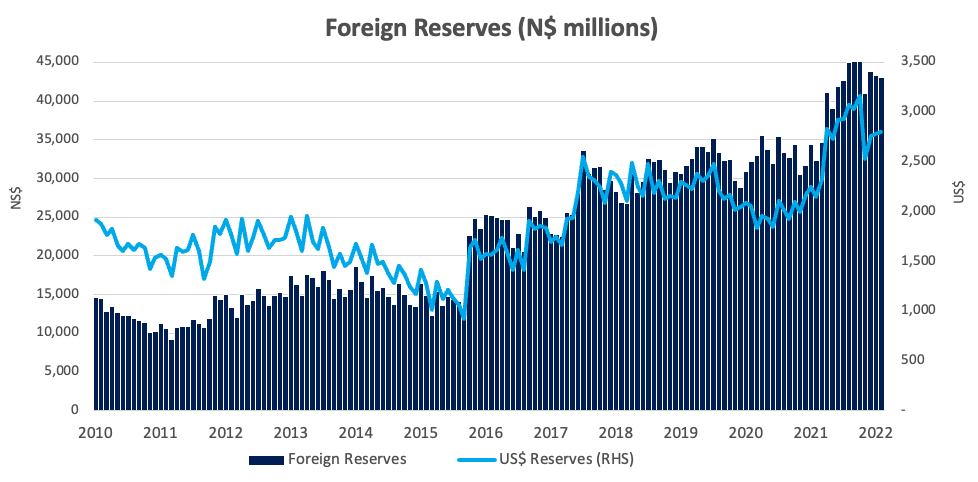
Reserves and Money Supply
According to the BoN’s latest monetary statistics, Broad Money Supply (M2) rose by N$2.00 billion or 1.6% y/y to N$127.2 billion. Foreign reserve balances fell by 0.6% m/m or N$271.0 million to a total of N$43.0 billion. The decline was contributed to net commercial bank outflows, which in turn was attributed to an increase in the import bill (specifically in the category of mineral fuels and oils) during the period. We believe that the high fuel prices will continue to put pressure on the foreign reserve position going forward.
Outlook
PSCE posted strong growth for a second consecutive month, with the increase again being driven by a large increase in claims on non-resident private sectors. The BoN ascribed these increases to a loan uptake by one of the commercial banks from its parent company in South Africa. Normalising for these two large increases, sees PSCE growth at 2.5% y/y in January and 2.6% y/y in February, bringing the growth rate roughly in line with the average rate witnessed in 2021.
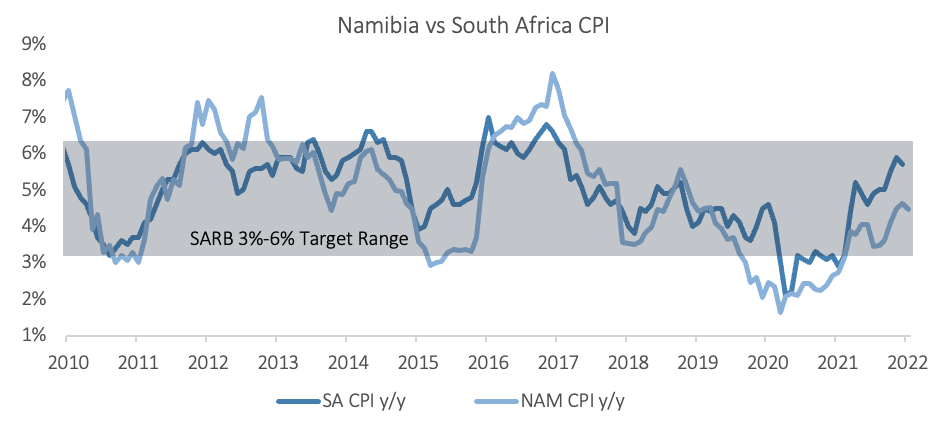
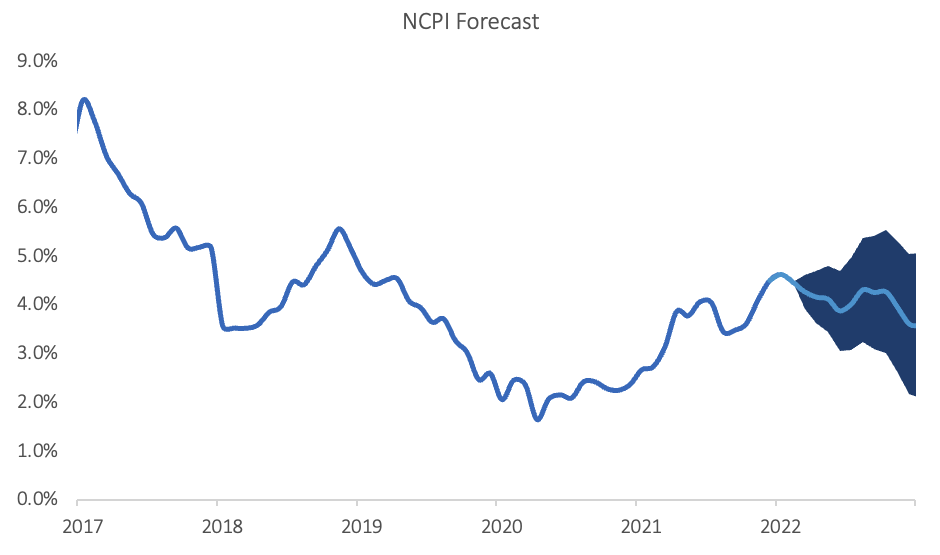
We expect the BoN to follow the SARB in hiking the repo rate by 25bps at its April MPC meeting, followed by an additional 3-4 hikes throughout the rest of the year, as inflationary pressure is expected to pick up. Still, even with 25 bp increases at every remaining meeting, interest rates should remain relatively accommodative by historical standards.