The Namibian annual inflation rate rose to 6.8% y/y in July, the quickest pace since March 2017. On a month-on-month basis, inflation remained steady at 1.0% m/m. Year-on-year, overall prices in eight of the twelve basket categories rose at a quicker rate in July than in June, two categories experienced slower rates of inflation and two categories posted steady inflation. Prices for goods increased by 10.0% y/y, the fastest since February 2009, while prices for services rose by 2.5% y/y.

Transport, the third largest basket item by weighting, was the largest contributor to annual inflation, contributing 3.0 percentage point to the total 6.8% y/y inflation rate. Prices in this category increased by 3.0% m/m and by 20.9% y/y in July, the largest year-on-year increase on our records dating back to 2003. All three sub-categories in this basket recorded increases on a month-on-month basis. Operation of personal transport equipment recorded the largest increase in prices of 4.4% m/m and 35.5% y/y, attributable to the N$1.88 and N$1.34 per litre increase in petrol and diesel prices, respectively, at the start of July. Year-to-date, petrol and diesel prices are up 42.4% and 46.1% respectively. The purchase of vehicles sub-category recorded inflation of 0.9% m/m and 5.2% y/y. Prices of public transportation services rose 0.1% m/m, but fell 4.1% y/y.
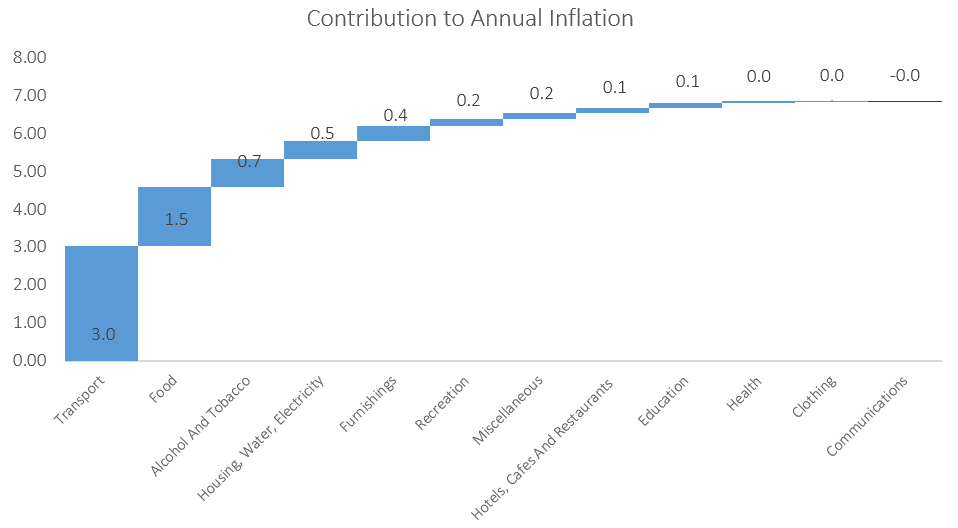
Food & non-alcoholic beverages was the second largest contributor to the annual inflation rate in July, contributing 1.5 percentage points. Prices in this basket item rose 0.8% m/m and 8.4% y/y, the quickest year-on-year increase since February 2017. All sub-categories registered price increases on an annual basis. The largest increases were observed in the oils and fats sub-category, which increased by 26.5% y/y and fruits, which rose by 24.5% y/y. On a monthly basis, twelve of the thirteen sub-categories saw price increases with only the meat sub-category recording a price decrease of 1.1% m/m.
The third largest contributor to the annual inflation rate in July was the alcohol & tobacco basket item, recording inflation of 0.4% m/m and 5.4% y/y. The prices of alcoholic beverages increased by 0.4% m/m and 5.4% y/y while the price of tobacco products increased by 0.6% m/m and 5.4% y/y.
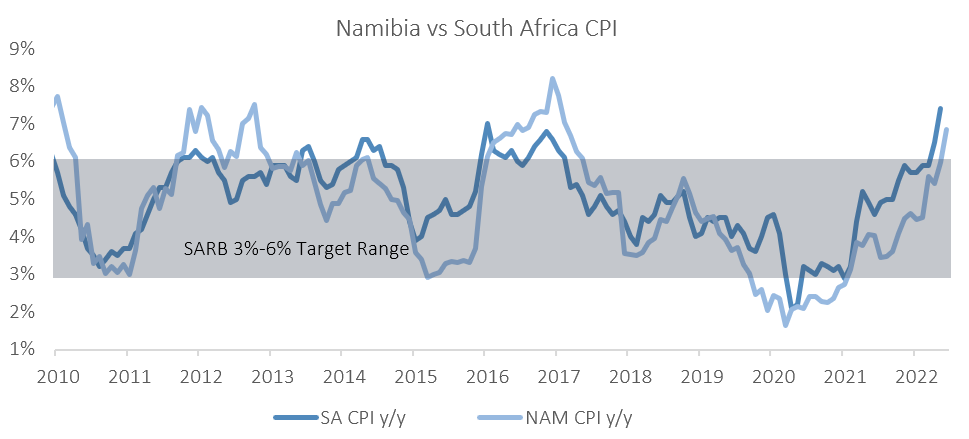
Namibia’s annual inflation rate has consistently been trending higher since August last year, and as mentioned earlier in the report, July’s print is the quickest since March 2017. While the rate is high, it is by no means extraordinary for Namibia, as it has reached (and breached) this level a couple of times over the past two decades. Rising transport and food prices continue to be the main drivers for Namibia’s inflation rate, with the two categories contributing 67% to the annual inflation rate in July. Higher transport costs should continue to filter through to other categories of goods and services via second round effects, but runaway domestic inflation is unlikely. A similarly high inflation rate in South Africa has prompted the South African Reserve Bank (SARB) to pick up the pace of tightening monetary policy, with the 75 bp rate hike in July coming in higher than most forecasts. The SARB appears to be front-loading rate increases, opting to stay ahead of central banks in developed markets, and reinforcing its commitment to anchoring inflation expectations and to preserve its credibility. We expect the Bank of Namibia’s MPC to respond in-kind at their August meeting. IJG’s inflation model currently forecasts the annual Namibian inflation rate to continue ticking higher over the next couple of months, and to average between 5.9% and 6.5% in 2022, before gradually moderating to an average of 5.6% in 2023.