Building Plans – September 2021

The City of Windhoek approved 228 building plans in September, a 9.9% m/m decrease from the 253 approved in August. The total value of approvals decreased by 2.2% m/m to N$158.1 million. So far in 2021 there have been 1,819 approvals, valued at N$1.41 billion. This year-to-date figure is 14.4% higher in number terms and 16.1% higher in value terms than at the same time last year. On a 12-month cumulative basis, the number of building plans approved rose by 20.7% y/y to 2,511, while the value of these approvals rose by 25.1% y/y to N$2.05 billion. 234 construction projects were completed in September at a value of N$120.3 million, a high in both number and value terms for the year. Year-to-date, 1,203 plans, valued at N$638.2 million have been completed, a 54.8% contraction in value terms compared to the same period a year ago. On a 12-month cumulative basis the value of completed projects is down 57.3% y/y.

Over the past decade additions to properties have averaged roughly 44% of the total value of approved construction projects. On trend, additions to properties made up 41% of the total value of approvals in September. 143 additions were approved at a value of N$64.2 million, a 13.3% m/m decrease in number, but a 12.5% m/m increase in value from the N$57.1 million approved in August. Year-to-date, 1,126 additions have been approved at a value of N$530.2 million, a 3.4% decrease in number, but a 3.6% increase in value from September 2020. Compared to the preceding three months September saw a large spike in the number and value of additions completed, with 162 additions completed in the month at a value of N$44.7 million. In fact, September saw a greater number, and value, of additions completed than in the previous three months (June, July and August) combined.

New residential units were the second largest contributor to the total number of building plans approved with 81 approvals. Residential units did however contribute the most value, with total residential approvals valued at N$86.9 million. In terms of value, that N$86.9 million represents a 3.3% m/m increase from August’s figure of N$84.1 million. Year-to-date, 664 units worth N$781.8 million have been approved. This represents a year-to-date increase in value of residential units of 84.7% y/y. On a 12-month cumulative basis, the number of residential units approved increased by 98.0% y/y and by 90.0% y/y in value.

72 new residential units were completed in September at a value of N$75.6 million. In terms of value, September was the best month for residential construction in Windhoek in 2021. On a 12-month cumulative basis, the number of residential units completed comes to 563 at a value of N$511.4 million and while this translates to a year-on year decrease of the 12-month cumulative figure, the number and value of completed residential construction projects from July through to September 2020 was unnaturally high. So, with those values now omitted from the 12-month cumulative calculations it is unsurprising to see that the 12-month cumulative value of residential units completed has decreased by 50.8% y/y in value. This has everything to do with those three months in 2020 seeing abnormally high figures for the value of completed projects (see last month’s report for a more detailed explanation of why that is) and nothing do with 2021 being an unusually slow year for residential construction.

In September four commercial units, valued at N$7.0 million, were approved. Year-to-date, 29 commercial buildings have been approved at a combined value of N$94.8 million. September also marks the sixth consecutive month with zero commercial building project completions. Over this time, 25 projects have been approved. So, while projects are not being completed the fact that commercial projects continue to be approved is encouraging, although the value of these projects are significantly smaller than they were pre-pandemic.

On a 12-month cumulative basis, the number of buildings completed fell by 30.5% y/y and 57.3% y/y in terms of value. As alluded to in the previous paragraph, and as explained in the conclusion of the previous report, there is a simple mechanical explanation for this and now the 12-month cumulative value of plans completed simply gives a more accurate picture of short-term construction trends than it did two months ago. Additionally, the year-on-year change of the 12-month cumulative value of plans completed will remain negative for several more months while the overall health of the construction industry is likely to hover around its early 2019 level.

12-month cumulative approvals do paint a better picture, with a 20.7% y/y increase in number terms and 25.1% y/y in value, however these increases are from a low base and the majority of approvals continue to be made up of additions to properties which are of lower relative value.

New Vehicle Sales – September 2021

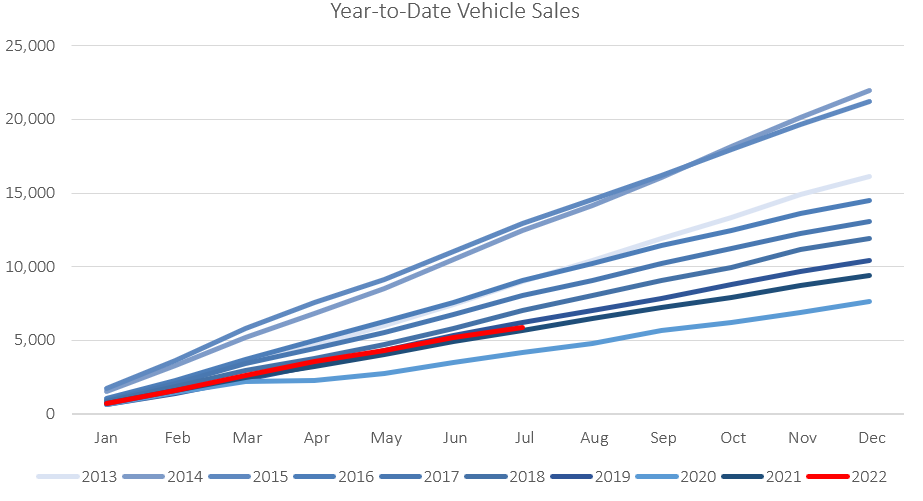
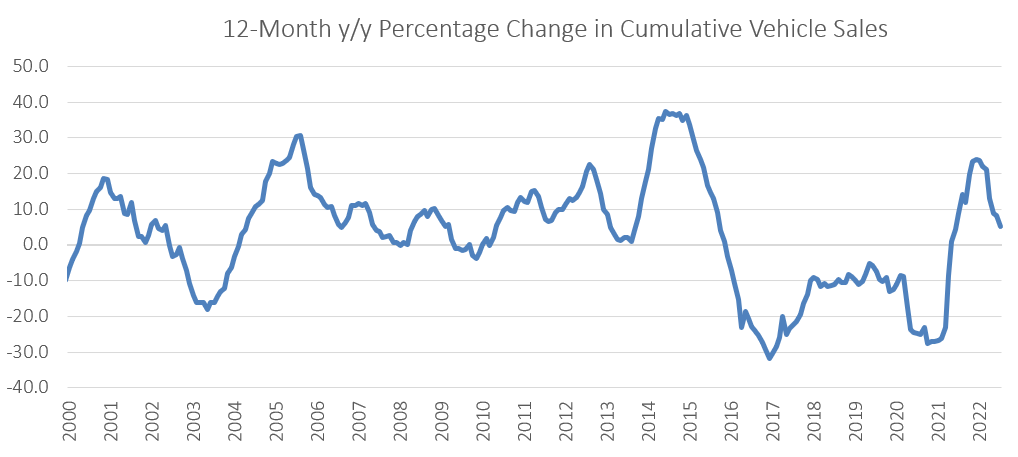
767 new vehicles were sold in September, a near identical number to the 762 sold in August. This brings the total number of new vehicle sales in 2021 to 7,221. On a year-on-year basis, new vehicle sales declined by 12.2%. On a 12-month cumulative basis, vehicle sales have grown by 11.8% to 9,186. September is usually a better month for new vehicle purchases. In fact, 767 represents the smallest number of new cars sold in the month of September over the past decade, lower even than 2020’s September figure. As such, 2021 remains on track to be the second worst year for car sales in the past decade.

380 new passenger vehicles were sold in September, a 12.4% increase from the 338 sold in August and a 36.7% increase from this time last year. Year-to-date, the sale of new passenger vehicles increased by 51.2% y/y. On a 12-month cumulative basis, sales have increased by 33.6% y/y to 4,356. There is a distinct upward trend in the 12-month cumulative sales figures as it starts to shed the historically low sales numbers from 2020. If this modest upward trend continues there is a good chance that we will see 12-month cumulative sales figure reach late 2019 values by the end of 2021.

Total commercial vehicle sales fell by 8.7% m/m and 35.1% y/y in September. The biggest decline came in the light commercial vehicles category with sales falling by 14.1% m/m and 43.4% y/y to 304, the lowest monthly sales figure for the year. 16 medium commercial vehicles were sold in September, a 6.7% y/y increase but identical to the previous month’s figure. Lastly, 67 heavy commercial vehicles were sold, a 24.1% m/m increase and 52.3% y/y increase. On a 12-month cumulative basis, light commercial vehicle sales decrease by 5.7% y/y and medium commercial vehicle sales decreased by 10.6% y/y, while heavy commercial vehicle sales increased by 37.4% y/y.    

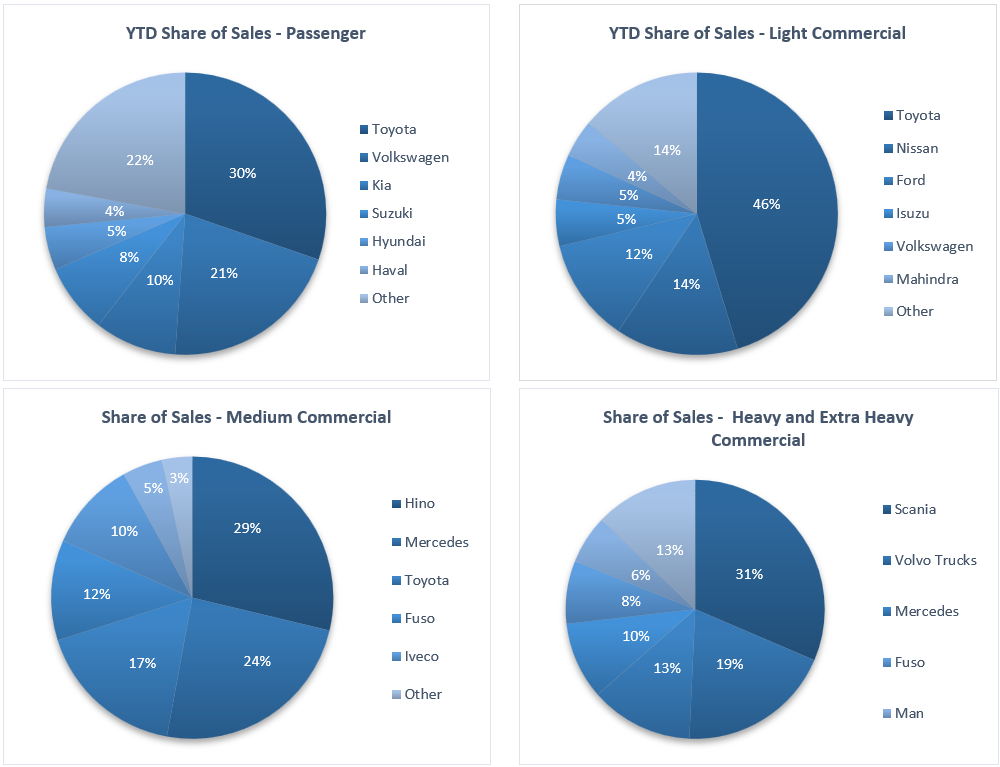
Volkswagen and Toyota continue to dominate the market for passenger vehicles, with each maintaining about a 30% share of the market in 2021. Given the ingrained popularity of these two brands it is unlikely that another car maker will be able to displace them in the short- to medium-term. Kia, Hyundai and Suzuki have market shares of 9%, 6% and 5% respectively. 

On a year-to-date basis, Toyota is the biggest seller of light commercial vehicles. They have a 54% share of the market so far in 2021. Mercedes is the main player in the medium commercial vehicles market with a market share of 32%. The German carmaker also has a 14% market share in the heavy and extra heavy commercial vehicle market. Scania has the largest market share in the heavy and extra-heavy commercial vehicle market with 24%.  

The Bottom Line  

In the context of 2021 September was an average month for vehicle sales in Namibia. The sale of passenger vehicles increased month-on-month and sales of commercial vehicles decreased, all but balancing each other out. While new vehicle sales remain generally sluggish, Namibia’s situation is not unique. Car sales are down in Europe and the US as the global shortage of semiconductors rolls on. However, Namibia’s declines are best explained by consumers not being able to afford new vehicles and corporates not replacing their fleets.

NCPI September 2021

The Namibian annual inflation rate rose to 3.5% y/y in September after it had slowed to 3.4% in August. Prices in the overall NCPI basket rose by 0.3% m/m. On a year-on-year basis, overall prices in five of the twelve categories rose at a quicker rate in September than August, five categories experienced slower rates of inflation and two categories posted steady inflation. Prices for services rose by 1.7% y/y while prices for goods rose by 4.8% y/y.

Transport, the third largest basket item by weighting, was the largest contributor to annual inflation, contributing 1.0 percentage point to the total 3.5% y/y inflation rate. Prices in this category increased by 1.5% m/m and by 7.5% y/y in September. Prices in two of the three sub-categories recorded increases on an annual basis. Vehicle prices increased by 10.4% y/y and prices in the sub-category “operation of personal transport equipment” increased by 11.6% y/y. The price of public transport services decreased by 8.3% y/y. Due to base effects, we are likely to see another year-on-year increase in this sub-category in October, which will put further upward pressure on the transport inflation print.

The increases in transport costs can be attributed partly to increases in the price of oil. A lack of investment in the supply of oil (constructing new oil rigs and refineries), coupled with a sustained increase in global demand for energy means that prices for oil are expected to remain high in the short to medium-term. In summary, rising transport costs, driven by sustained increases in the price of oil, are likely to continue exerting upward pressure on the inflation figure as we are likely to see second round effects should transport prices remain elevated.  

Food & non-alcoholic beverages was the second biggest contributor to the annual inflation rate in September, contributing 0.9 percentage points. Prices in this basket category increased by 0.1% m/m and 5.0% y/y. All sub-categories registered price increases on an annual basis. The largest increases were observed in the oils and fats subcategory, which increased by 17.7% y/y, and meat prices, which rose by 12.1% y/y. On a monthly basis, twelve of the thirteen sub-categories saw price increases while only the price of vegetables decreased, by 2.3% m/m.  

The third largest contributor to the annual inflation rate in September was the alcohol & tobacco basket item, recording inflation of 0.5% m/m and 3.0% y/y. The prices of alcoholic beverages increased by 0.3% m/m and 1.8% y/y while the price of tobacco products increased by 1.1% m/m and 8.6 % y/y.

The 3.5% y/y annual inflation rate is in line with IJG’s average inflation forecast for the year. IJG’s inflation model predicted that annual inflation rate would be 3.4% y/y in September. Inflation risks remain to the upside. Elevated global shipping costs and the ongoing shortage of microchips and semiconductors pose a threat to production in a variety of industries. IJG’s inflation currently predicts that annual inflation will rise to 3.6% y/y in November and 3.8% y/y in December 2021. Average annual inflation for 2022 is forecast at 3.6% y/y. Given current data, the estimated upper bound for annual inflation in Namibia in 2022 is 4.7% y/y. The current uncertainty in the global economy makes this is a highly tentative prediction.