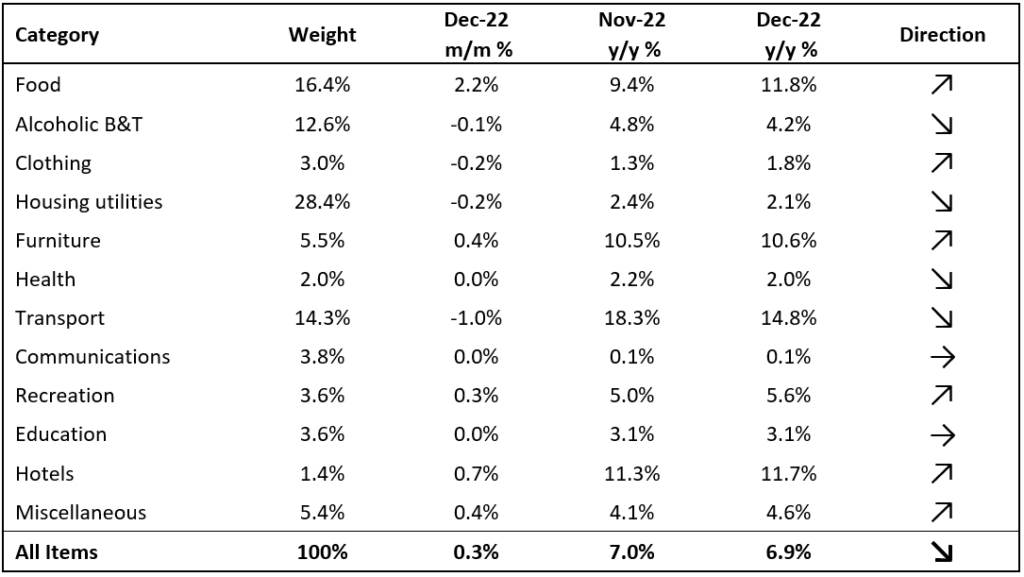
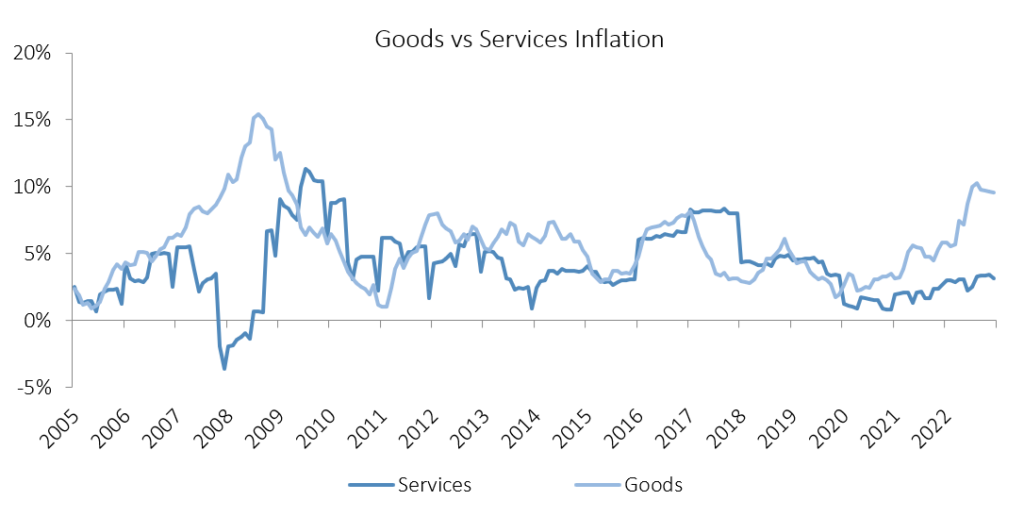
Namibia’s annual inflation rate softened to 6.9% y/y in December. Prices in the overall NCPI basket rose by 0.3% m/m, marginally slower than last month. Year-on-year, overall prices in six of the twelve categories rose at a quicker rate in December than in November, four categories experienced slower rates of inflation and two categories posted inflation rates consistent with those in November. Prices of goods increased by 9.6% y/y, steady from last month. Services inflation continues to trend well below goods inflation and slowed to 3.1% y/y in December.
Inflation Attribution
Transport inflation remained the largest contributor to Namibia’s annual inflation rate, contributing 2.21 percentage points to the annual inflation rate in December. Prices in this basket item rose by 14.3% y/y but contracted by 1.0% m/m, mainly due to the 125c per litre drop in the price of diesel that came into effect in early December. All the sub-categories in the transport basket item bar the purchase of vehicles recorded slower inflation on an annual basis in December. The purchase of vehicles sub-category recorded price increases of 0.2% m/m and 4.5% y/y. Prices in the operation of personal transport equipment sub-category fell by 1.6% m/m while inflation slowed to 22.6% y/y, the slowest over the past 8 months and a sign that the relatively lower oil prices started to filter into the operating costs. Notable price relief in this sub-category is almost certain to show again in next month’s inflation print after the Ministry of Mines and Energy lowered diesel prices by a further 220 cents per litre and petrol by 180 cents per litre at the beginning of January. Prices in the public transportation services sub-category climbed by 0.1% m/m and 1.4% y/y, the slowest annual rise in prices since July 2022.
The food & non-alcoholic beverages item was the second largest contributor to the annual inflation print, marginally behind the transport basket item after it contributed 2.19 percentage points in December. Prices in this basket item rose by a sizeable 2.2% m/m and 11.8% y/y, the steepest annual inflation print since January 2017. While inflation in four of the thirteen sub-categories slowed with 1 remaining steady, the bulk of the sub-categories in this basket item recorded price increases on an annual basis in December, strikingly for the 12th consecutive month. Oils and fats saw the largest prices increase on an annual basis, rising by 20.8% y/y, followed by fruits which saw prices rise by 20.5% y/y. Bread and cereals prices also saw a sharp increase in December, rising by 6.7% m/m and 18.2% y/y, the steepest annual price increase recorded in this sub-category over the past decade.
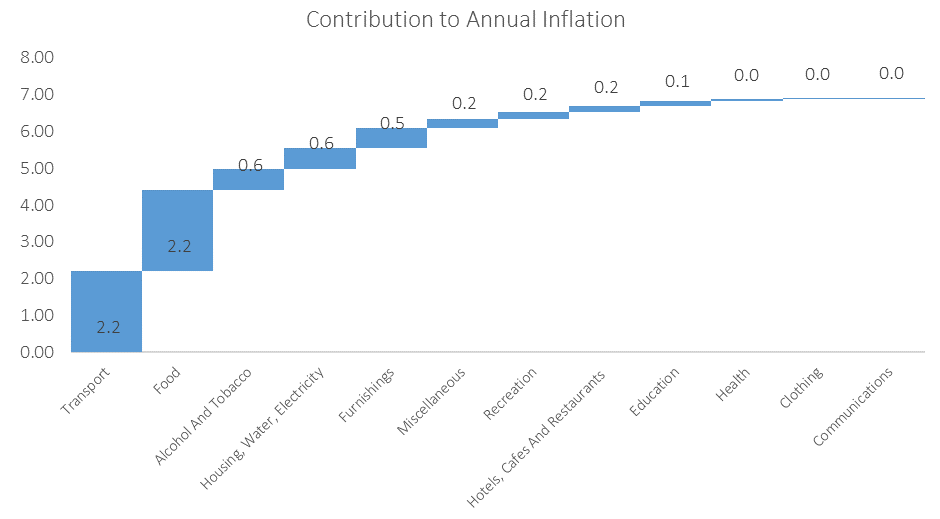
The alcohol & tobacco category was the third largest contributor to the inflation rate, marginally higher than Housing, Water and Electricity- and Furniture basket items. Inflation of alcohol and tobacco products slowed to 4.2% y/y in December, but continues to trend above the 3.8% inflation rate reported for this basket item a year ago. Housing, water and electricity inflation softened to 2.1% y/y, yet remained above the 1.2% y/y inflation reported in December last year. The prices of furniture increased by 10.6% y/y in December compared to 1.3% y/y a year ago.
Outlook
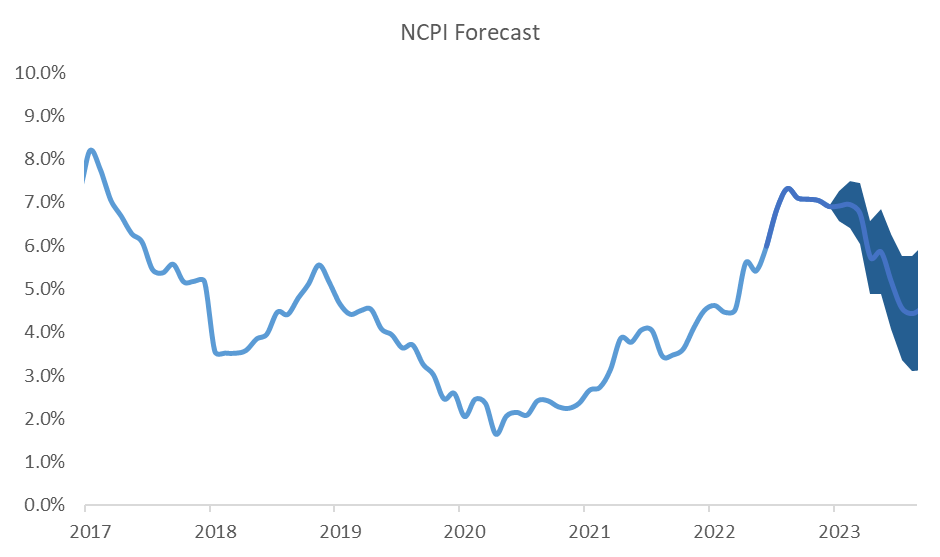
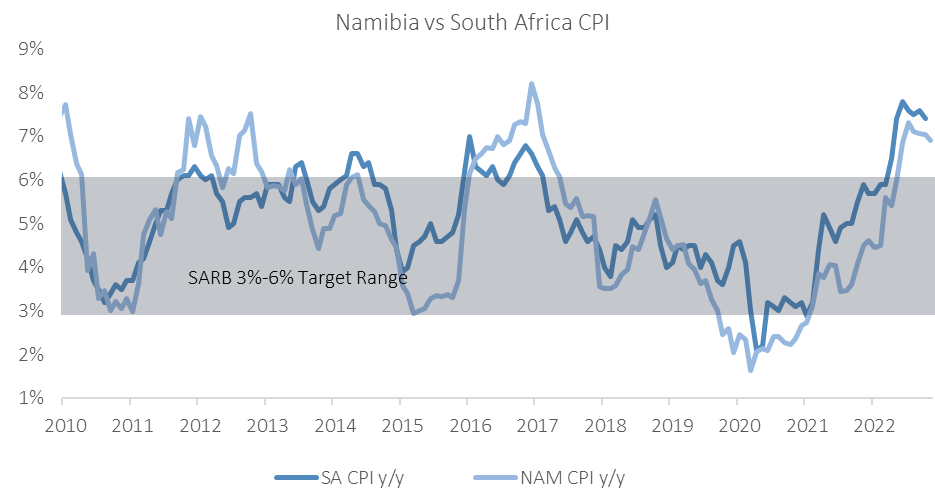
December saw Namibia’s annual inflation rate continuing to trend lower with the print falling below 7.0% for the first time since July 2022 and steadily moving back towards the upper end of the SARB’s target range.
While we expect inflation to continue to slow into 2023, a close eye will be kept on January’s print as the month usually marks the revision of rental prices in the NCPI basket, which anchors about a quarter of the inflation basket for the rest of the year. The current economic climate and property market dynamics have us believe that we could see another year of relatively low inflation in this line item for 2023, but somewhat higher than last year.
The SARB’s first MPC meeting for 2023 is scheduled to take place on 26 January. Recent below-expectation inflation numbers coupled with lower fuel prices and moderating food prices should all provide the SARB (and by extension the BoN) leeway to slow the pace of rate hikes.
IJG’s inflation model currently forecasts Namibia’s annual inflation rate to continue to steadily slow during the course of 2023, before reaching around 4.1% at the end of the year.