Building Plans – November 2021

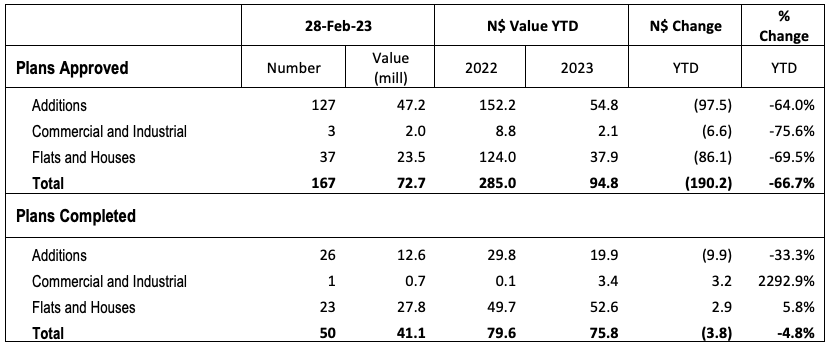
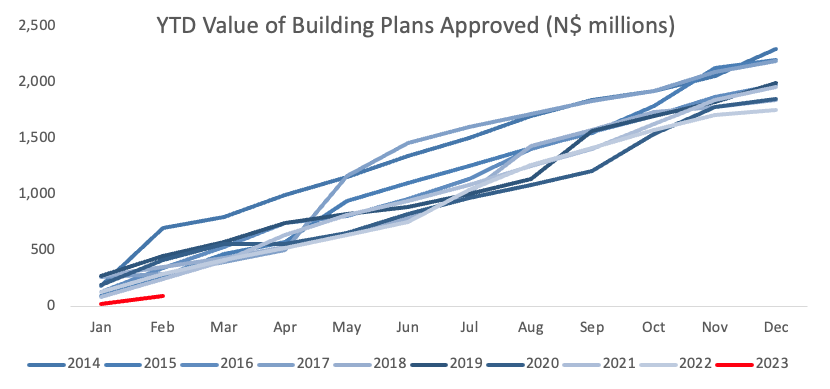
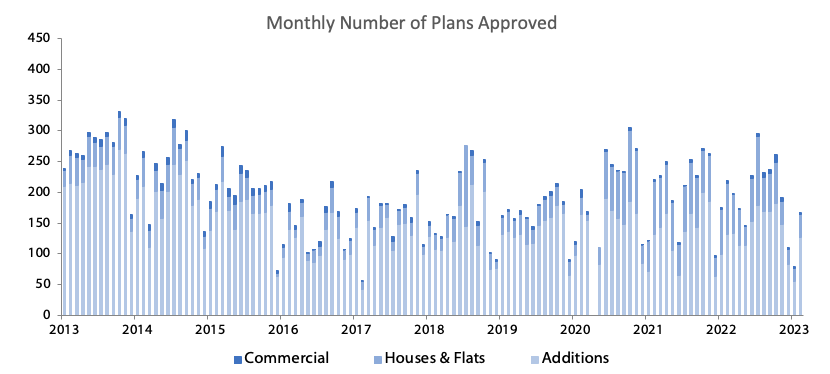
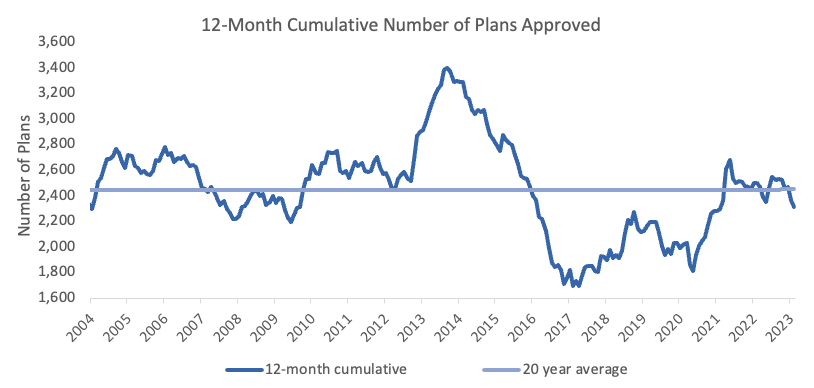
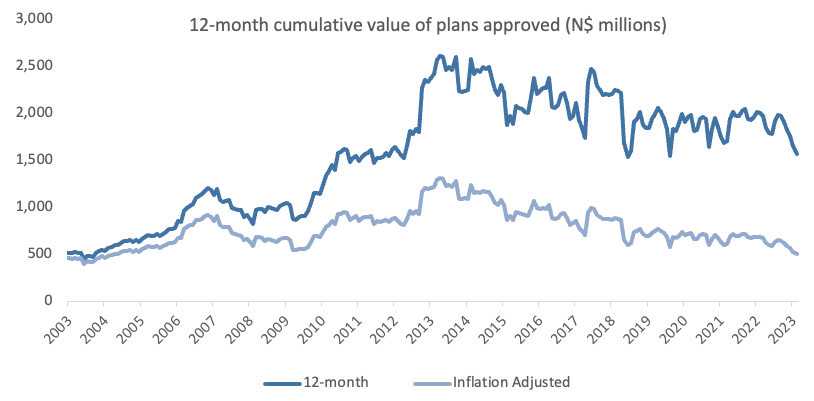
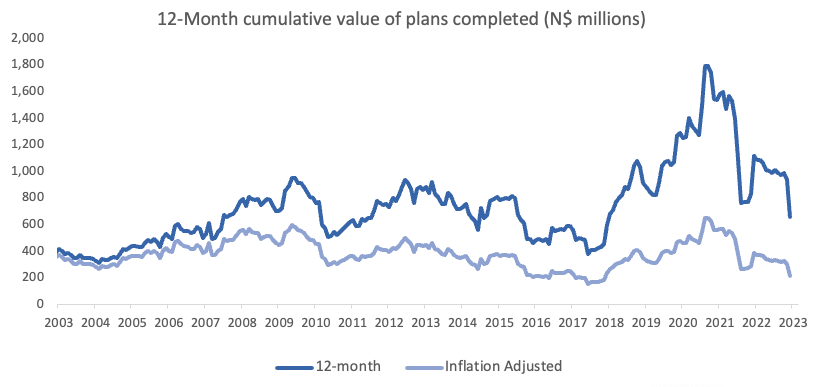
In November the City of Windhoek approved 263 building plans, a 3.0% m/m decrease from the 271 approved in October. The total value of approvals decreased by 2.1% m/m to N$216.9 million. On a 12-month cumulative basis, the number of approvals has risen by 9.3% y/y to 2,468 but the value of these approvals has declined by 1.1% y/y to N$1.92 billion. Year-to-date there have been 2,353 approvals valued at N$1.85 billion. 139 construction projects were completed in November at a value of N$99.9 million. In terms of value, this equates to a 147.1% y/y increase and a 71.0% m/m increase. However, on a 12-month cumulative basis the value of completed projects is down 46.3% y/y.  

185 additions to properties were approved at a value of N$107.9 million in November, making November the best month, in terms of value, for addition approvals in 2021. This represents a 12.1% y/y increase in number and 13.5% y/y increase in value. Month-on-month this translates to a 7.5% decrease in number but a 37.9% increase in value. 47 additions to properties were completed in November at a value of N$11.1 million. The latter months of 2020 saw a particularly slow rate of construction completions, therefore the year-on-year change in the value of additions completed has doubled (approximately 101.1% y/y increase in value). On a year-to-date basis, the number of additions to properties completed stands at 855, at a value of N$233.8 million. While the number of additions completed by this time last year is similar (866 by November 2020) the value of those additions stood significantly higher, at N$444.8 million.   

75 residential units were approved in November at a value of N$105.5 million, translating to an 8.7% m/m increase in number and a 29.6% m/m increase in value. Year-to-date 808 units have been approved at a value of N$968.8 million. These numbers compare favourably to last November’s year-to-date figures when only 610 residential units were approved at a value of N$798.2 million. Accordingly, on a 12-month cumulative basis, the value of residential approvals increased by 9.3% y/y and the number of approvals by 7.9% y/y. 90 residential units were completed in November at a value of N$70.8 million, making November the best month for the number of residential unit completions in 2021. On a 12-month cumulative basis the number of residential properties completed now stands at 596, with a collective value of N$540.6 million. Following the trend seen in completions of additions to properties, the 12-month cumulative value figure for residential units completed has fallen by 46.3% y/y.

In November three commercial units with a combined value of N$3.5 million were approved. Year-to-date 34 commercial units worth N$160.3 million have been approved. In terms of value, that’s 47.4% lower than at the same time last year. Two commercial units were completed in November at a value of N$18.1 million. After six consecutive months with zero completions Windhoek has now seen back-to-back months with commercial completions, the first time that has happened in 2021. Encouragingly, this means that the year-to-date value of commercial construction projects completed is higher now than it was at the same time in 2020.

On a 12-month cumulative basis, the number of building plans completed fell by 8.3% y/y and by 46.3% y/y in terms of value. Given the severity of the general economic contraction in the past 18 months this is not surprising. The year-on-year change of the 12-month cumulative value of plans completed is therefore likely to remain negative for several more months.

As the year draws to a close, we now have a sufficiently detailed picture of how well the construction industry faired in 2021. In a phrase, 2021 was not all that bad. The year-to-date figure for total building plan approvals stands at N$1.85 billion, that’s a 3.9% y/y increase from the N$1.78 billion approved by last November. The success and rate with which these approvals are converted into completions will go a long way to determining the fortunes of the construction sector in 2022.  While the year-to-date value of total building completions remains well off 2020 levels, in the context of the last five years the figure (N$796.5 million y-t-d completions by November 2021) doesn’t look out of place (5-year November average; N$913.8 million).   

New Vehicle Sales – November 2021

752 new vehicles were sold in November, a 5.3% m/m increase from the 714 sold in October and a 7.4% y/y increase from the 700 sold last November. In November, more passenger vehicles, light commercial vehicles and heavy commercial vehicles were sold than in October. Fewer medium commercial vehicles were sold. On a 12-month cumulative basis, vehicle sales have grown by 23.3% y/y to 9,391. Year-to-date, new vehicle sales have increased by 25.8% to 8,687. However, this is 10.5% lower than the year-to-date figure for November 2019, when 9,706 vehicles were sold. As such, 2021 remains on track to be the second worst year for new vehicle sales in the past decade.

376 new passenger vehicles were sold in November, 20 more than in October, translating to a 5.6% m/m increase and a 10.3% y/y increase. On a 12-month cumulative basis, new passenger vehicle sales have increased by 39.7% y/y to 4,449. Year-to-date, 4,115 new passenger vehicles have been sold. This represents a 43.1% increase from the year-to-date figure for November 2020, when only 2,876 new passenger vehicles were sold. Encouragingly, on a year-to-date basis, new car sales for November almost reached 2019 levels, with the 4,115 sold so far this year only 140 fewer than the 4,255 sold by November 2019. Compared to commercial vehicle sales (4,572 year-to-date sales in 2021 vs 5,451 year-to-date sales in 2019), passenger vehicle sales have enjoyed a stronger recovery in 2021.

376 commercial vehicles were sold in November, a 5.0% m/m increase and 4.7% y/y increase. 316 light commercial vehicles were sold, translating to a 7.1% m/m increase but a 1.6% y/y decrease. 18 medium commercial vehicles were sold, four fewer than the 22 sold in October. So far this year the average number of medium commercial vehicle sales per month is 17. 42 heavy commercial vehicles were sold in November, a near identical number to the 41 sold in October.

Toyota and Volkswagen retain the largest year-to-date market shares in the passenger vehicle market. Toyota’s year-to-date market share is unchanged from October’s figure of 29%, while Volkswagen’s dropped 1% m/m to 27%. Kia, Suzuki and Hyundai have market shares of 9%, 6% and 6% respectively.

On a year-to-date basis, Toyota continues to dominate the light commercial vehicles market. Toyota’s market share currently stands at 52% in 2021. Ample competition in the medium commercial vehicle sector means that Hino and Mercedes both capture a significant share of the market, with year-to-date market shares of 31% and 29% respectively. In the heavy and extra-heavy commercial vehicle market Scania, Volvo and Man continue to enjoy strong market shares, with 29%, 19% and 15% respectively.

The Bottom Line  

In the context of 2021, November was an average month for vehicle sales in Namibia. Therefore, 2021 remains on track to be the second worst year for vehicle sales in the past decade.  As alluded to earlier in this report, the marginal recovery from the nadir that was 2020 has been driven predominantly by a recovery in passenger vehicle sales, with commercial vehicle sales still lagging well behind 2019 levels. With persistent global headwinds such as supply chain bottlenecks and semiconductor shortages conspiring to drag down vehicle sales globally, and in Namibia, there is no guarantee that 2022 will be a markedly better year for new vehicle sales.

PSCE – October 2021

Overall

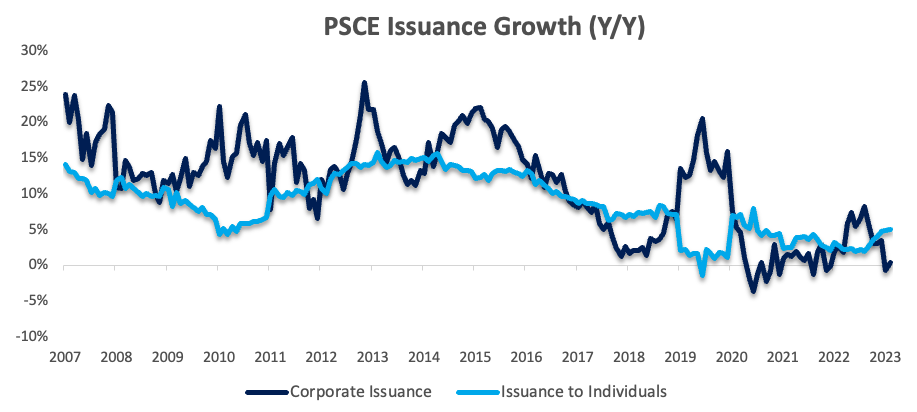
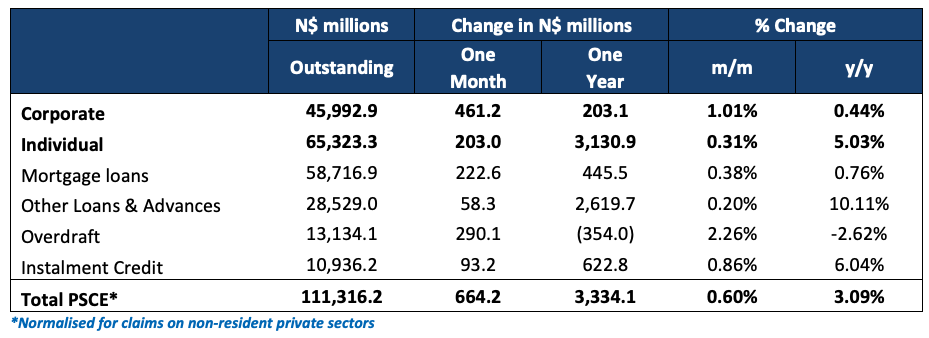
Private sector credit (PSCE) increased by N$700.0 million or 0.66% m/m in October, bringing the cumulative credit outstanding to N$106.4 billion. On a year-on-year basis, private sector credit increased by 2.69% in October, down slightly from growth of 2.74 % y/y in September. On a 12-month cumulative basis N$2.79 billion worth of credit was extended to the private sector. Individuals continue to take up the majority of this cumulative issuance. After two months of consecutive month-on-month declines in total claims on the private sector, in July and August, total claims have now risen month-on-month in both September and October. Over the longterm the outlook is less encouraging. From the start of 2015 until December 2019, PSCE grew by an average of 9.41% y/y. Since the start of 2020 average year-on-year growth has fallen to 2.75% y/y, despite several interest rate cuts last year. A positive reversion in this trend seems unlikely in the short-term.

Credit Extension to Individuals

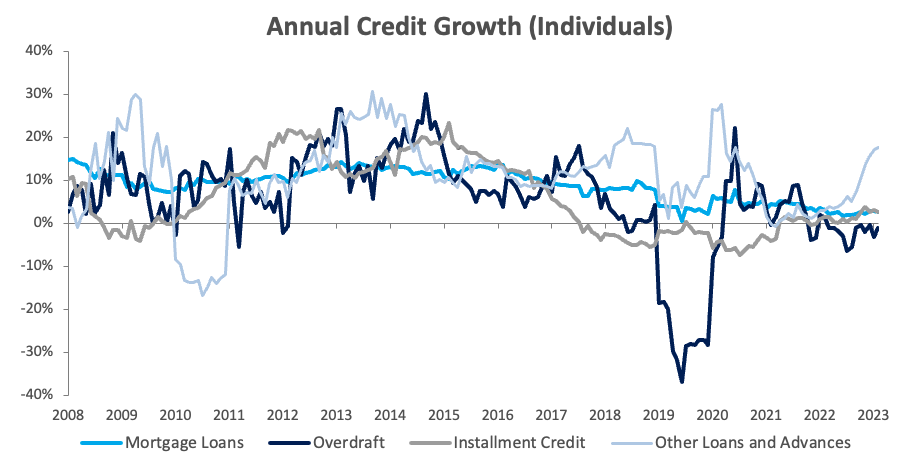
Credit extended to individuals decreased by 0.11% m/m but increased by 2.78% y/y in October. On a month-on-month basis, ‘other loans and advances’ (consisting of credit card debt, personal- and term loans) increased by 1.7% m/m. The other two subcategories of loans & advances, namely mortgage loans and overdraft, shrunk by 0.2% m/m and 2.2% m/m in October. Instalment credit shrunk by 0.8% m/m. On a year-on-year basis all subcategories of loans & advances registered increases in October. Mortgage loans increased by 3.2% y/y, other loans and advances grew by 2.6% y/y and overdrafts grew by 1.2% y/y. Overall growth of credit extended to individuals remains sluggish. In the four years prior to 2020, total credit extensions to individuals grew at an average of 8.1% y/y. Since 2020 that figure has fallen to 4.6% y/y.

Credit Extension to Corporates

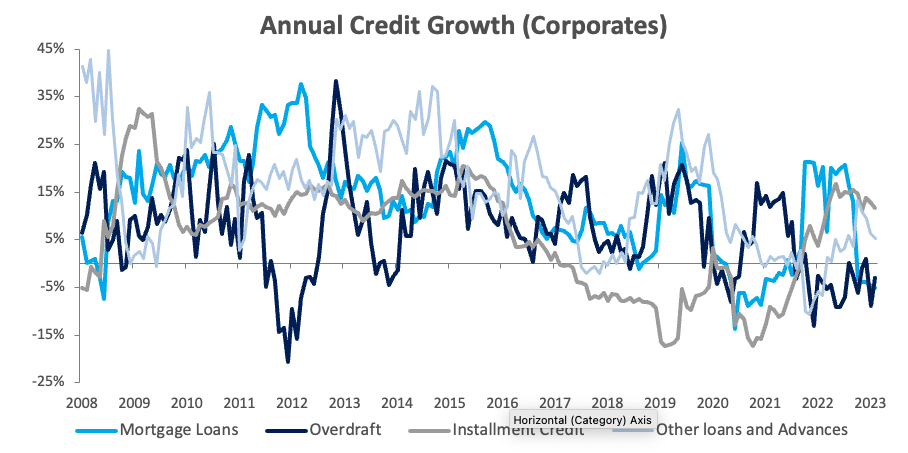
Credit extended to corporates grew by 1.78% m/m and 3.00% y/y in October. Total corporate loans & advances grew by 1.7% m/m. Specifically, mortgage loans grew by 2.3% m/m, other loans and advances grew by 1.3% m/m and overdrafts grew by 1.6% m/m. Instalment credit grew by 2.4% m/m. The trend is broadly similar on year-on-year basis. Total corporate loans & advances grew by 2.8% y/y in October, with all sub-categories recording increases. This is also the first time in 2021 that there have been two successive month-on-month increases in credit extensions to corporates, although the growth is subdued.

Banking Sector Liquidity

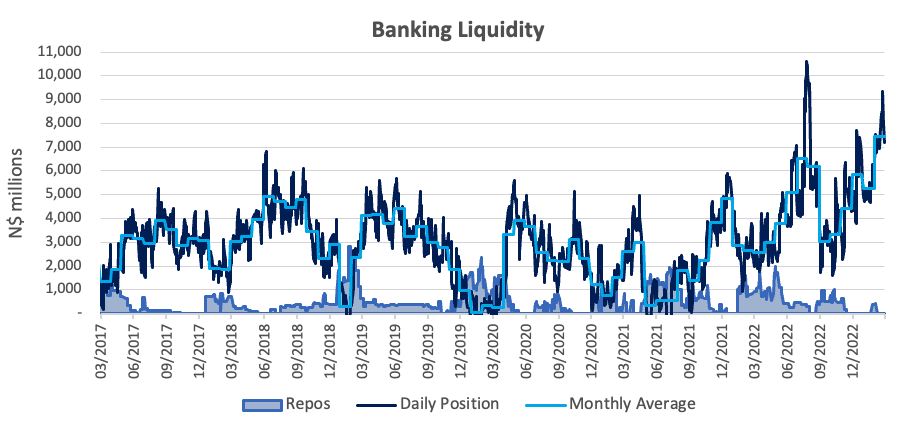
The overall liquidity position of Namibia’s commercial banks increased in October, rising by N$832.9 million to an average of N$2.23 billion. The BoN attributes the increase to cash inflows from diamond sales, coupon payments and increased government expenditure. Accordingly, the total balance of repos outstanding decreased in October. The repo balance fell to N$200.9 million at the end of the month after ending September at N$907.7 million.

Reserves and Money Supply

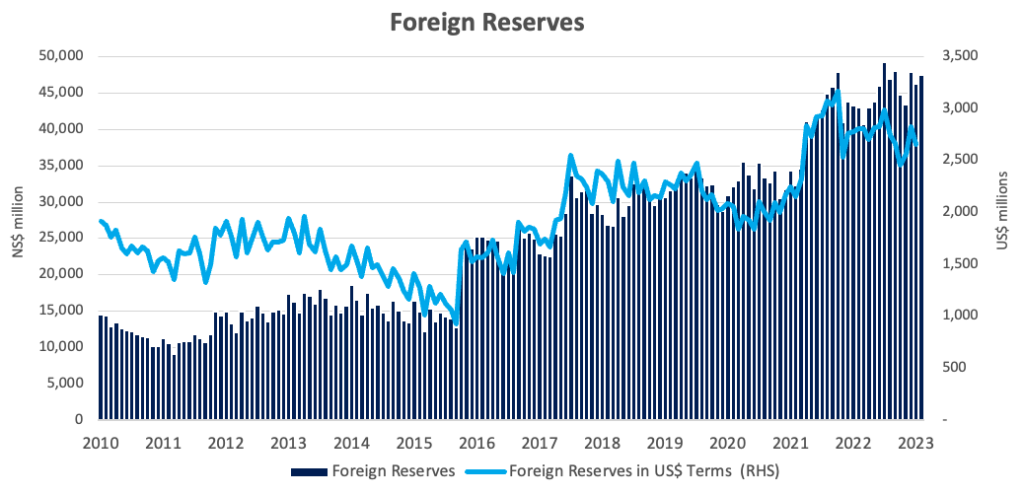
Broad Money Supply (M2) increased by N$5.70 billion or 1.0% y/y in October, according to BoN’s latest monetary statistics. The money supply increased by 4.6% m/m, increasing to N$128.8 billion after ending September at N$123.1 billion. The broad money supply for September was revised upwards marginally by approximately N$215.5 million. The BoN’s stock of international reserves rose by 4.4% m/m to N$47.9 billion in October.

Outlook

PSCE growth in October remained subdued, in line with the sluggish trend in growth that has now persisted for the best part of two years. The South African Reserve Bank’s (SARB) monetary policy committee (MPC) raised the South African Repo Rate for the first time in almost three years during its last meeting on 18 November. The rate hike came off the back of elevated inflation that threatened to rise beyond 6.0% y/y, the upper-bound of the SARB’s inflation target. While the rate hike may ease inflation concerns it will not stimulate growth in the private sector credit markets. Despite this hike, Namibia’s repo rate is now equal to the that of South Africa’s, so there is no immediate need for the BoN’s MPC to hike, however we expect them to follow suit at the 15 December meeting. Regardless, there are plenty of external forces conspiring to supress growth in private sector credit extensions and not all that many working to stimulate it. Weak growth is likely to continue in the short to medium-term.