Building Plans – April 2022

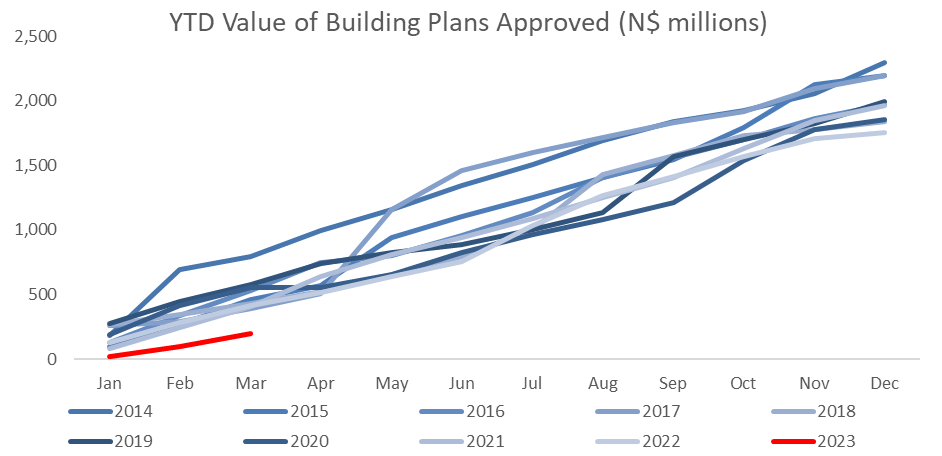
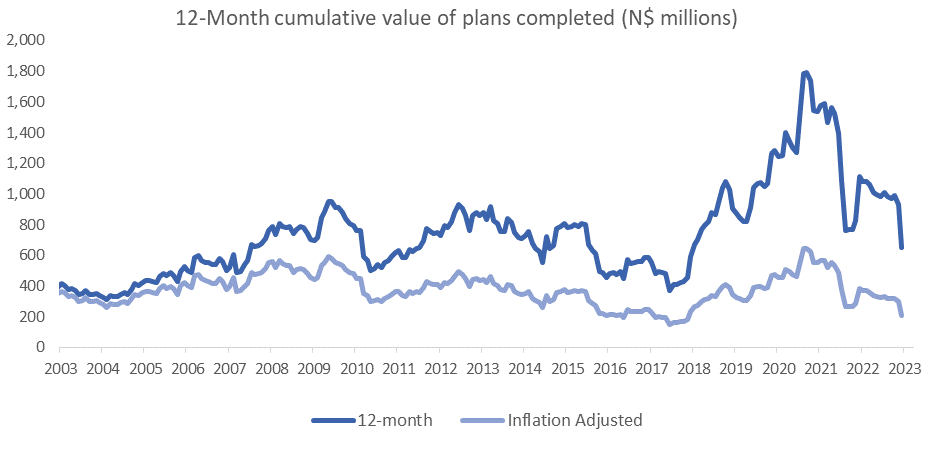
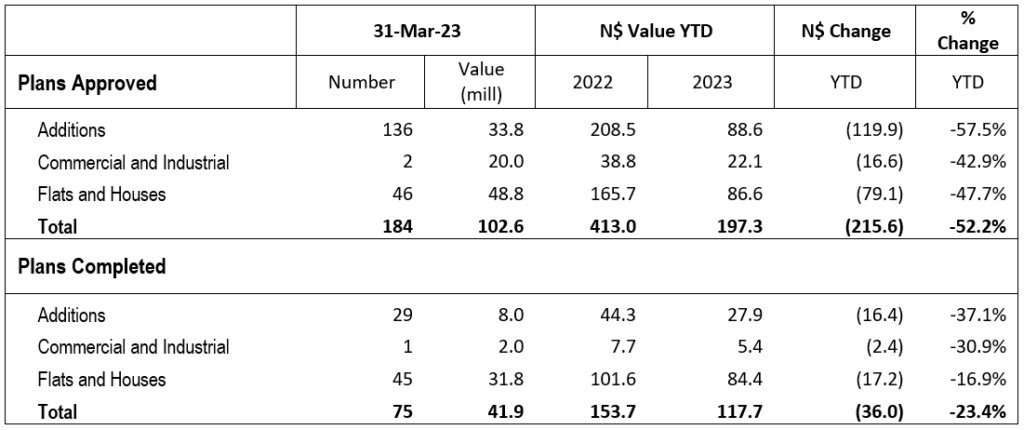
The City of Windhoek approved 173 building plans in April, representing a 12.6% m/m decline from the 198 building plans approved in March. In monetary terms, the approvals were valued at N$106.0 million, a 17.2% m/m contraction. Year-to-date 766 building plans worth N$519.0 million have gotten the nod, a decrease in number of 6.7% y/y, and 18.9% y/y in value terms. On a twelve-month cumulative basis 2,396 building plans worth N$1.84 billion were approved, a contraction of 8.1% in number, and 4.9% in value terms over the prior 12-month period. 78 building plans worth N$43.0 million were completed during the month.
Additions to properties once again made up the largest portion of approvals, in both number and value terms. For the month of April 114 additions to properties were approved with a value of N$63.0 million, compared to 133 approvals worth N$56.2 million in March. The data shows a single addition worth N$31.0 million being approved during the month, making up nearly half the total value of additions to properties approved during the month. Year-to-date 478 additions to properties have been approved with a value of N$240.4 million, a contraction of 6.5% y/y in number terms but an increase of 7.1% y/y in value terms. 35 additions worth N$10.3 million were completed in April.

New residential units were the second largest contributor to the number and value of building plans approved with 58 approvals registered in April, 5 fewer than in March. In value terms N$42.7 million worth of residential units were approved in April, a 2.1% m/m increase. On a year-on-year basis the value of approvals is however 67.1% lower than registered in April 2021. On a 12-month cumulative basis the number of residential units approved fell by 7.1% y/y to 820 and the number has been ticking down since September last year. 42 New residential units worth N$32.7 million were completed in April.

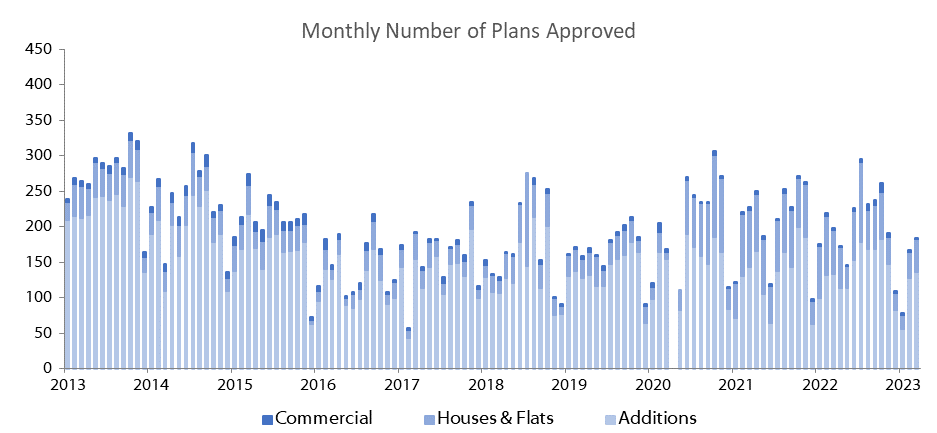
Only one commercial unit, valued at N$380,000 was approved in April. This brings the total number of commercial buildings approved in 2022 to 10, at a value of N$39.2 million. Bar one month, the number of approvals for commercial and industrial properties has been languishing in the single-digit territory since September 2016 and has an average approval rate of fewer than 3 approvals per month over the last 12 months. On a rolling 12-month basis, the number of commercial and industrial approvals increased to 35 units, worth approximately N$184.4 million, an increase of 67.2% in value terms from the period ending April 2021. One commercial building plan was recorded as completed in April, valued at N$65,000. 

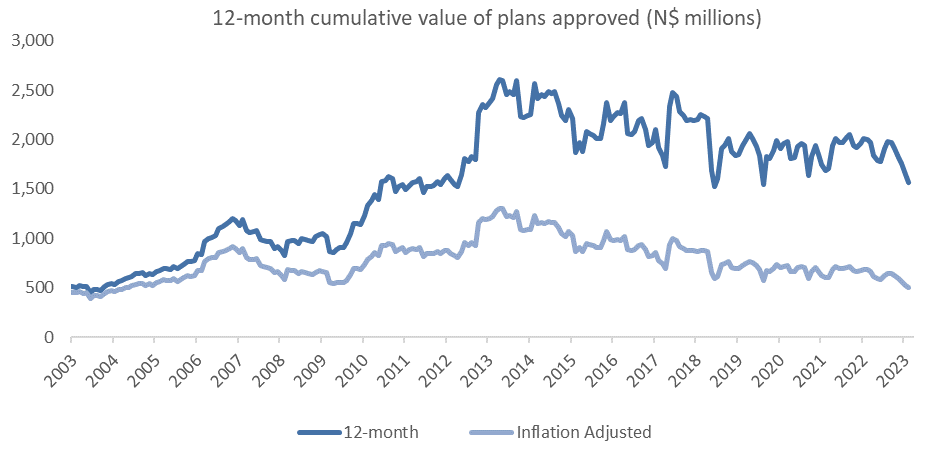
As illustrated in the figure above, the cumulative value of building plans approved continues to trend downward in both nominal and inflation-adjusted terms. As approvals is a forward-looking measure of expected construction activity this does not bode well for economic activity in the capital in general. Commercial and industrial construction activity remains extremely subdued. Going forward we expect lower value additions to properties to continue making up the majority of approvals.

NCPI April 2022

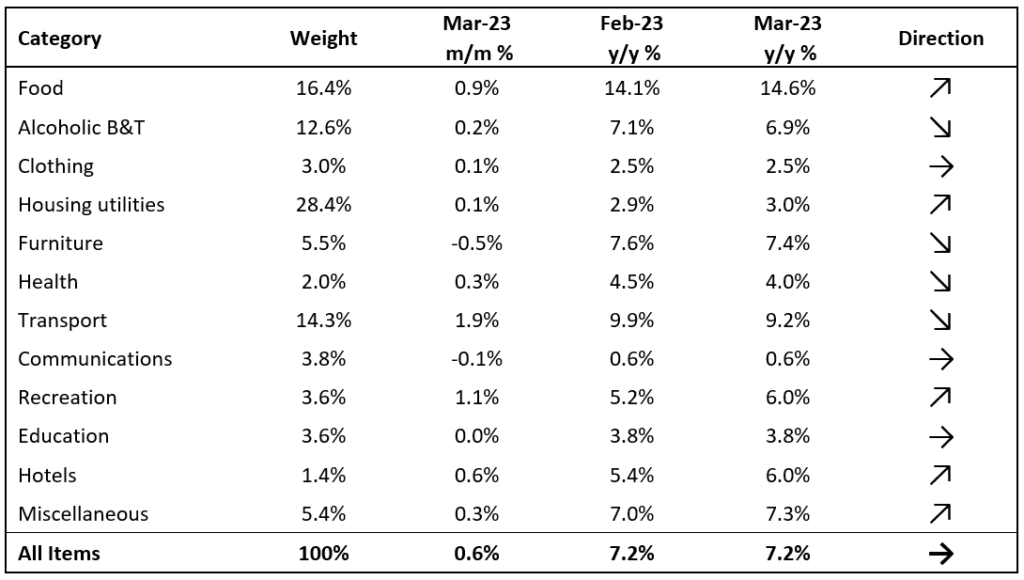
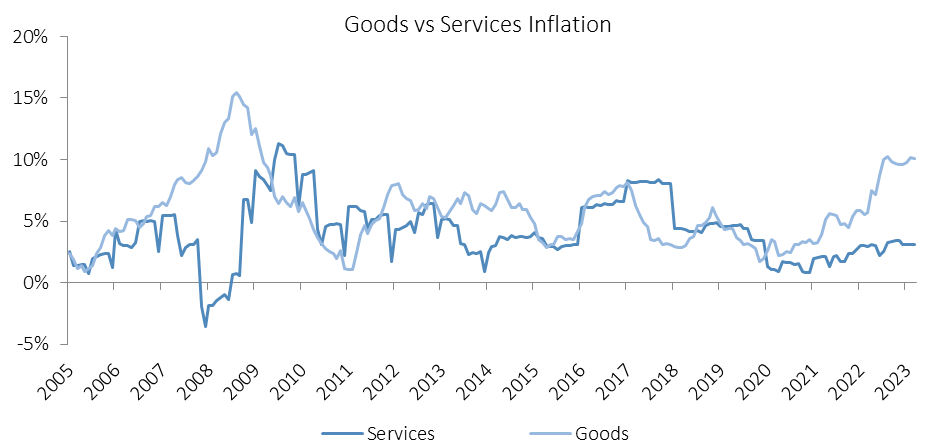
The Namibian inflation rate rose to 5.6% in April, materially quicker than the 4.5% rate recorded in March. Prices in the overall NCPI basket rose by 1.4% m/m, the largest monthly increase since January 2018. On a year-on-year basis, overall prices in seven of the twelve basket categories rose at a quicker rate in April than in March, with two categories recording slower rates of inflation and three categories recorded prices consistent with the prior month. Prices for goods increased by 7.5% y/y while prices for services increased by 3.1% y/y in April.

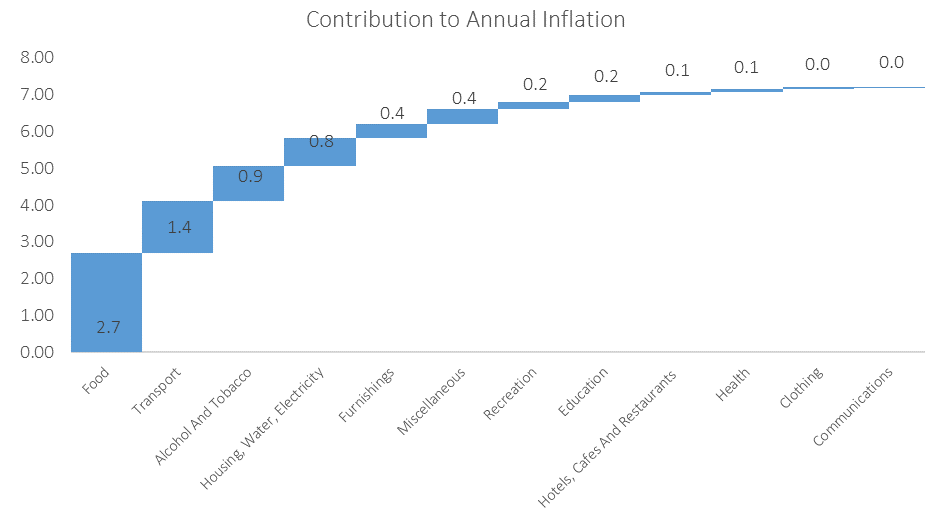
Rather unsurprisingly, transport was the largest contributor to the annual inflation rate again in April, contributing 2.7 percentage points to the total 5.6% y/y inflation rate. Prices in this category rose by 5.7% m/m and 18.9% y/y. All three sub-categories in this basket item recorded higher inflation on both a monthly and annual basis. The Namibia Statistics Agency’s (NSA) data shows that transport prices were up 9.5% by the end of April. The operation of personal transport equipment sub-category recorded price increases of 8.8% m/m and 27.3% y/y, following the  Ministry of Mines and Energy’s decision to increase petrol and diesel prices by 195- and 295 cents per litre, respectively, in April. Prices of public transportation services rose by 0.1% m/m and 9.8% y/y, in line with the rate recorded last month. The purchase of vehicles sub-category recorded inflation of 1.4% m/m and 5.2% y/y. The Ministry of Mines and Energy’s announcement at the beginning of May to temporarily lower several of the levies charged on fuel for the next three months was welcomed by consumers and businesses alike and should soften the inflationary impact of the high fuel prices to a certain extent.

Food & non-alcoholic beverages was the second biggest contributor to the annual inflation rate in April, contributing 1.1 percentage points. Prices in this basket item rose by 1.4% m/m and 5.7% y/y. As has been the case in the prior three months, all thirteen sub-categories recorded price increases on an annual basis. The largest increases were recorded in the prices of oils and fats which rose by 23.4% y/y, followed by fruit, which recorded prices increases of 13.8% y/y. The NSA’s data shows that consumers in the eastern, southern and western regions of the country paid the highest price for 750ml of pure sunflower oil at N$37.50, followed by the central region at N$32.60, while consumers in the northern parts of the country paid N$29.76. 

Alcohol & Tobacco inflation accelerated from 4.1% y/y in March to 4.5% y/y in April and was the third-largest contributor to April’s annual inflation rate. On a monthly basis, prices in the basket item increased by 0.9% m/m. The prices of tobacco products rose by 3.3% m/m and 6.3% y/y, while the prices of alcoholic beverages increased by 0.3% m/m and 4.1% y/y.

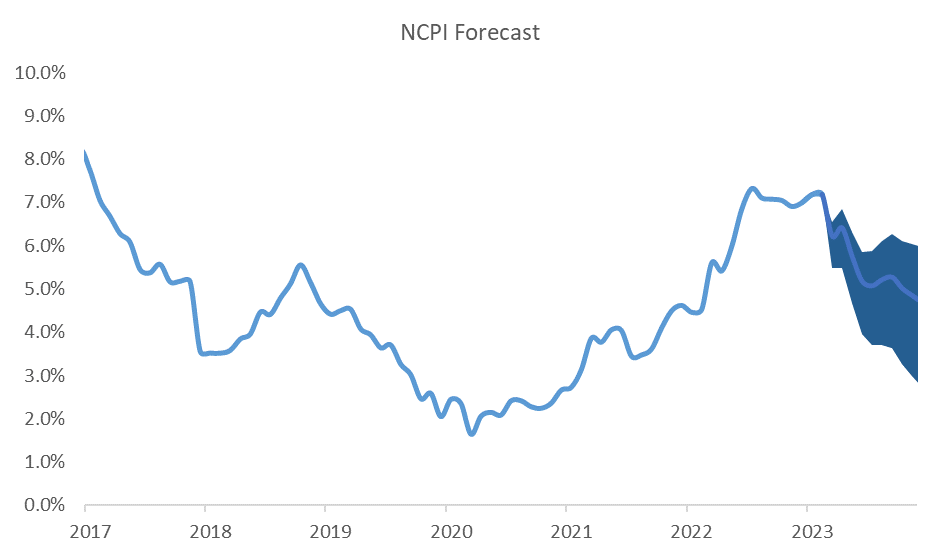
Namibia’s annual inflation rate of 5.6% in April is the highest rate in the last 58 months. Rising food and transport prices remain the primary drivers of the Namibian inflation rate, contributing 67% to the country’s annual rate in April. The uptick in the rate in April means that the 1.4 percentage point differential between Namibia and South Africa’s inflation rates that have been in place since August last year is now significantly smaller. South Africa’s inflation rate came in just below the SARB’s upper end of the target band at 5.9% in March. With inflationary pressure expected to remain high, the SARB’s MPC is expected to hike rates by 25 bps at its May meeting, leaving the BoN with little choice but to follow in-kind in at its MPC meeting June. IJG inflation model currently forecasts inflation to average between 5.0% and 6.2% in 2022. 

New Vehicle Sales – April 2022

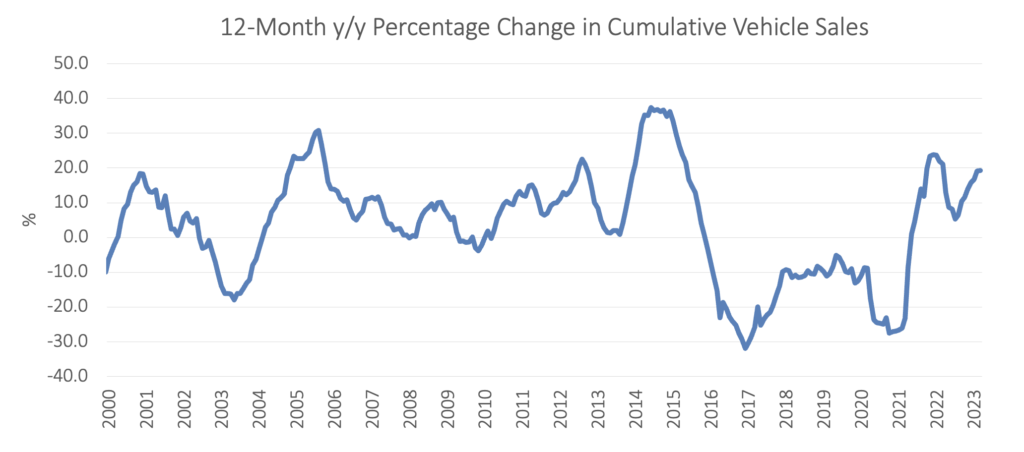
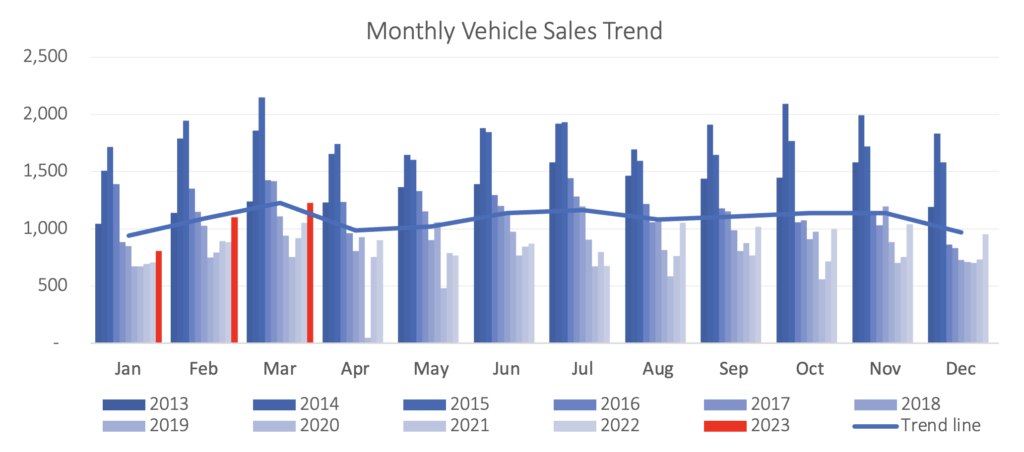
A total of 905 new vehicles were sold in April, a 14.1% m/m contraction but an increase of 19.9% y/y from the 755 vehicles sold in April 2022. Year-to-date 3,550 new vehicles have been sold, of which 1,841 were passenger vehicles, 1,491 light commercial vehicles, and 218 medium and heavy commercial vehicles. By comparison, the first four months of 2021 saw 3,260 new vehicles sold. On a twelve-month cumulative basis, a total of 9,718 new vehicles were sold at the end of April, representing a 13.0% y/y increase from the 8,602 sold over the comparable period a year ago.

466 new passenger vehicles were sold during April, 11.9% lower than the 529 passenger vehicles sold in March, but an increase of 30.2% from the 358 sold in April 2021. Year-to-date, passenger vehicle sales rose to 1,841, an increase of 23.6% than during the same period last year. On a rolling 12-month basis, passenger vehicle sales rose to 4,836, 29.2% higher than over the same period in 2021.

New commercial vehicle sales displayed a similar trend, declining month-on-month, but are up from the same month last year. 439 new commercial vehicles were sold in April, representing a month-on-month contraction of 16.4%, but a year-on-year increase of 10.6% y/y. 392 Light commercial vehicles, 17 medium commercial vehicles, and 30 heavy and extra heavy commercial vehicles were sold during the month. Light- and heavy commercial vehicle sales fell by 16.1% m/m and 30.2% m/m, respectively, while medium commercial vehicle sales rose by 13.3% m/m. On a twelve-month cumulative basis, light commercial vehicle sales are down 2.0% y/y, while medium commercial vehicle sales rose by 6.7% y/y, and heavy commercial vehicles climbed by 21.1% y/y.

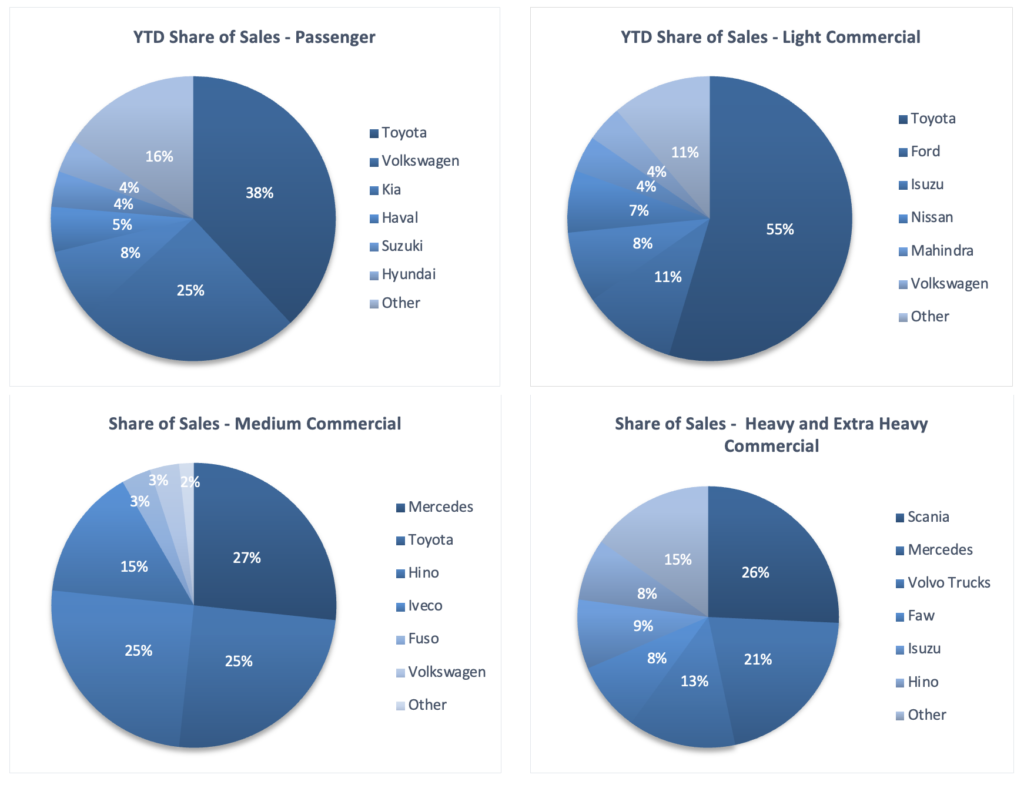
Toyota continues to lead the new passenger vehicle sales segment with 36.8% of the segment sales year-to-date, followed by Volkswagen with 20.4% of the market share. The two top brands maintained their large gap over the rest of the market with Kia and Suzuki following with 7.9% and 6.1% of the market, respectively, leaving the remaining 28.8% of the market to other brands.

On a year-to-date basis, Toyota maintained its dominance in the light commercial vehicle space with a 60.6% market share, followed by Nissan with 10.7% of the market. Hino leads the medium commercial vehicle segment with 37.7% of sales year-to-date. Scania remained number one in the heavy and extra-heavy commercial vehicle segment with 27.3% of the market share year-to-date. 

The Bottom Line  

We noted in last month’s report that March new vehicle sales generally have a seasonal effect of being slightly higher than the surrounding months, and that we expect to see April’s new vehicle sales to return to the levels witnessed in the last 18 months. This has now transpired with new vehicle sales being 14.1% lower than last month. New vehicle sales were however 19.9% higher than during the same month a year ago and 13.5% higher than the average monthly sales figure over the past twelve months. On a 12-month cumulative basis, new passenger vehicle sales continued to increase, rising for the 17th consecutive month. New commercial vehicle sales however continue to hover around the 4,800 level where it has been trending for the past year.