NCPI May 2023

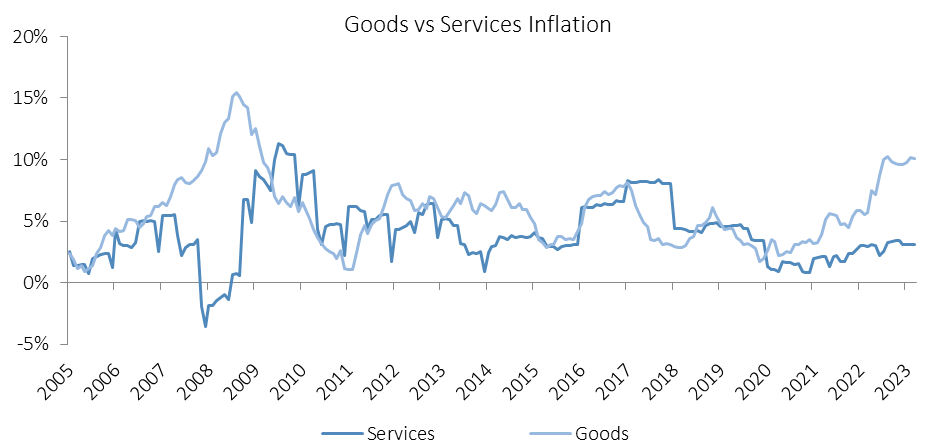
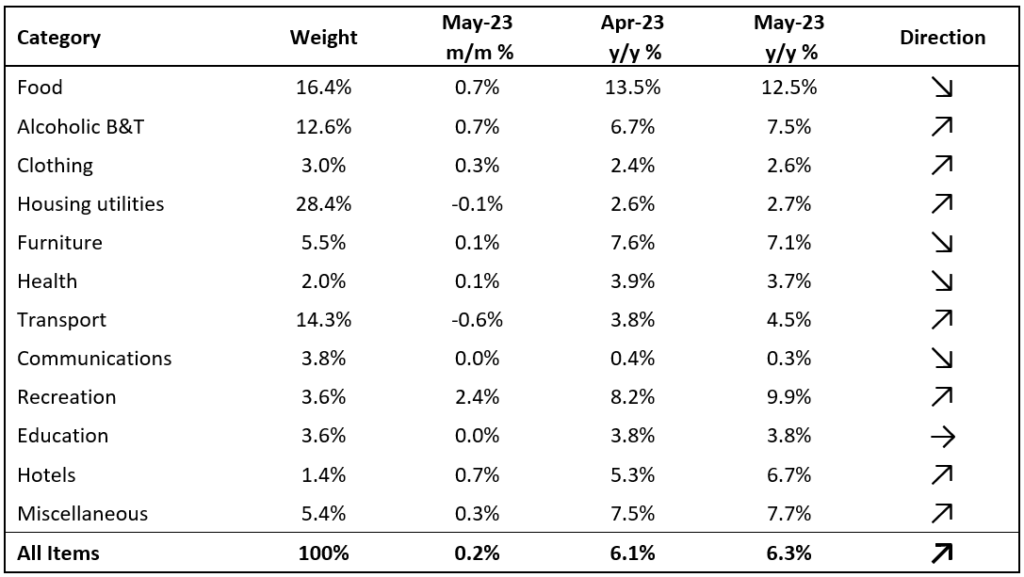
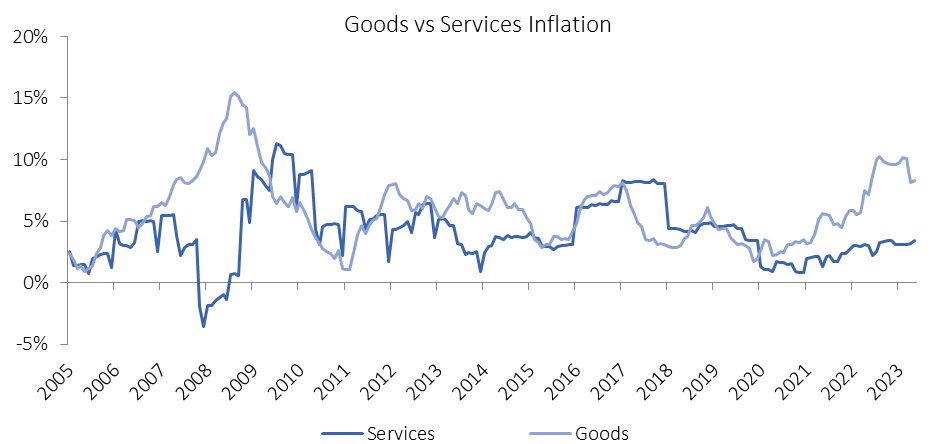
Namibia’s annual inflation rate edged up to 6.3% y/y in May, after softening to 6.1% y/y in April. On a month-on-month basis, prices in the overall NCPI basket rose by 0.2% m/m, following the 0.4% m/m increase in April. On an annual basis, overall prices in seven of the twelve basket categories rose at a quicker rate in May than in April, four categories recorded slower rates of inflation while the education category posted steady inflation. Both goods and services inflation edged higher in May, with goods inflation coming in at 8.3% y/y and services inflation at a much more subdued 3.4% y/y.
Inflation Attribution

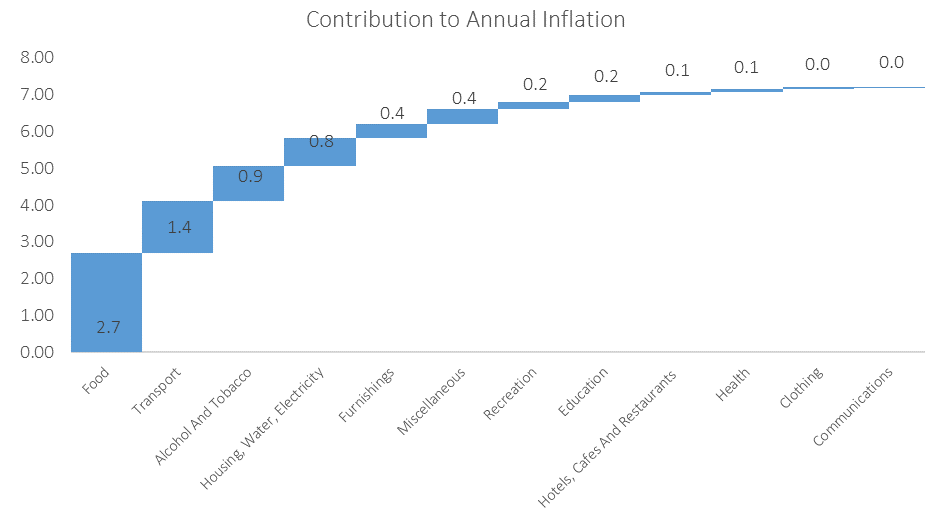
The Food and Non-Alcoholic beverages basket item was once again the largest contributor to Namibia’s annual inflation rate, contributing 2.4 percentage points in May. Prices of this basket item increased by 0.7% m/m and 12.5% y/y. Most of the sub-categories in this basket category witnessed slower annual inflation in May than in April but prices across the board remain relatively high. Fruits again posted the highest year-on-year inflation at 22.1% y/y in May (April: 29.1% y/y) while prices of items in the sub-category fell by 1.7% m/m. Fish saw the highest month-on month inflation with prices in this subcategory increasing by 4.5% m/m and 13.3% y/y. Oils and fats posted the most notable drop in inflation in May. Prices in this sub-category fell by 1.7% m/m while annual inflation slowed to 0.3% y/y in May (April: 10.7%).
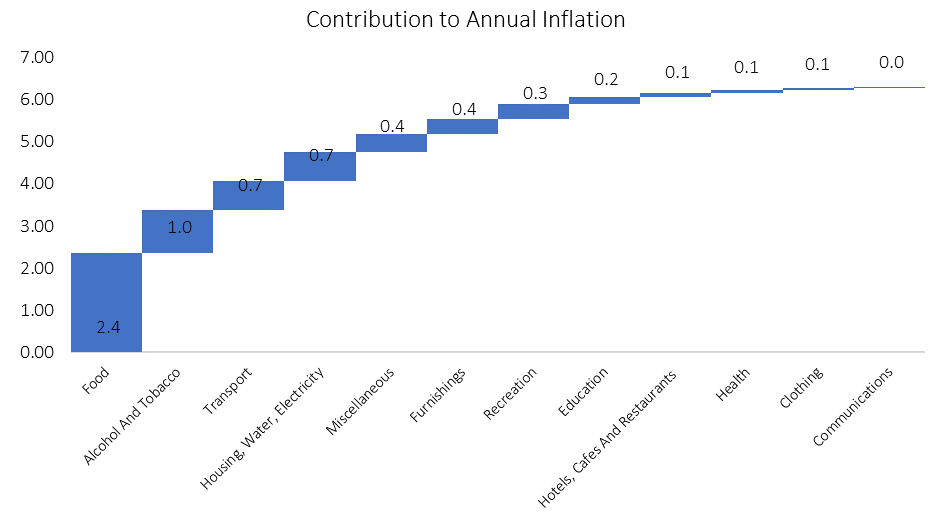
The Alcohol and Tobacco basket item was the second largest contributor to May’s inflation print, contributing 1.0 percentage points. Prices in this basket item rose by 0.7% m/m and 7.5% y/y, slightly up from the 0.6% m/m and 6.7% y/y witnessed in April. Prices of alcohol products rose by 0.7% m/m and 8.4% y/y, while tobacco product prices rose by 0.9% m/m and 3.5% y/y in May. All of the sub-categories in this basket item registered faster annual inflation in May than in April, bar Liqueurs which saw prices deflate by 1.8% y/y.

Transport was the largest contributor to inflation among the remaining basket items, edging Housing, Water, Electricity as one of the top three contributors to Namibia’s annual inflation rate, despite prices in this basket item dropping by 0.6% m/m. Public transport services inflation remained fairly steady at 0.1% m/m and 1.0% y/y. The operation of personal transport equipment inflation rose by 4.7% y/y in May, while the cost of operating personal transport equipment fell 1.1% m/m. The Ministry of Mines and Energy’s decision to lower the price of diesel 50ppm and 10ppm by 80c/litre and 60c/litre, respectively, with effect from June should bring further price relief for this sub-category going forward. Inflation on vehicles purchases slowed to 0.4% m/m and 6.5% y/y, from 1.1% m/m and 6.3% y/y a month earlier.
Outlook

Namibia’s inflation rate witnessed a slight increase in May, primarily driven by food price pressures that persist as a dominant factor in the inflation dynamics.

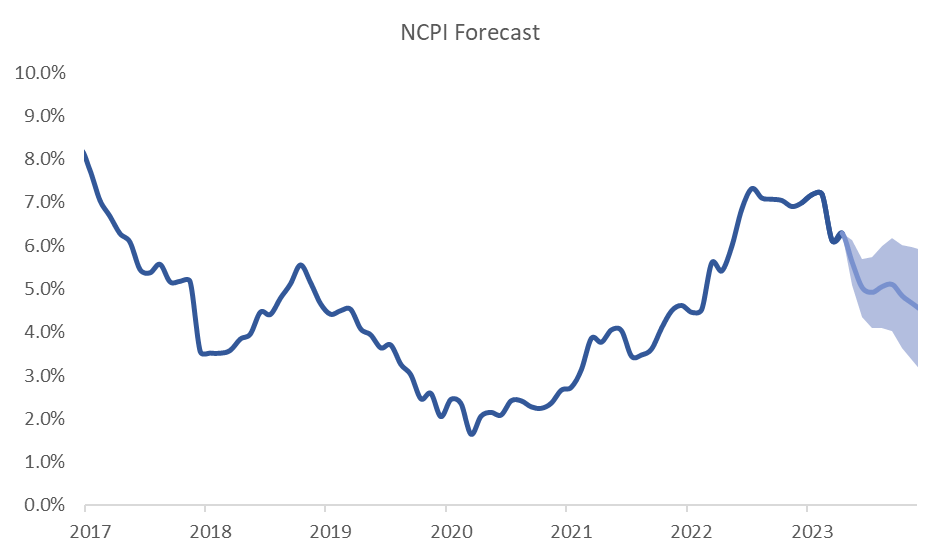
Despite these developments, it is expected that the annual inflation rate in Namibia will gradually decrease in the coming months. This is primarily due to base effects impacting the Transport category, as fuel prices are now only marginally higher compared to a year ago. However, if currency weakness persists, we could see upward price pressure on goods, resulting in a prolonged period of elevated inflation. The Bank of Namibia is expected to closely monitor these developments, and it may require implementing additional rate hikes beyond current expectations, similar to the situation observed in neighbouring South Africa.

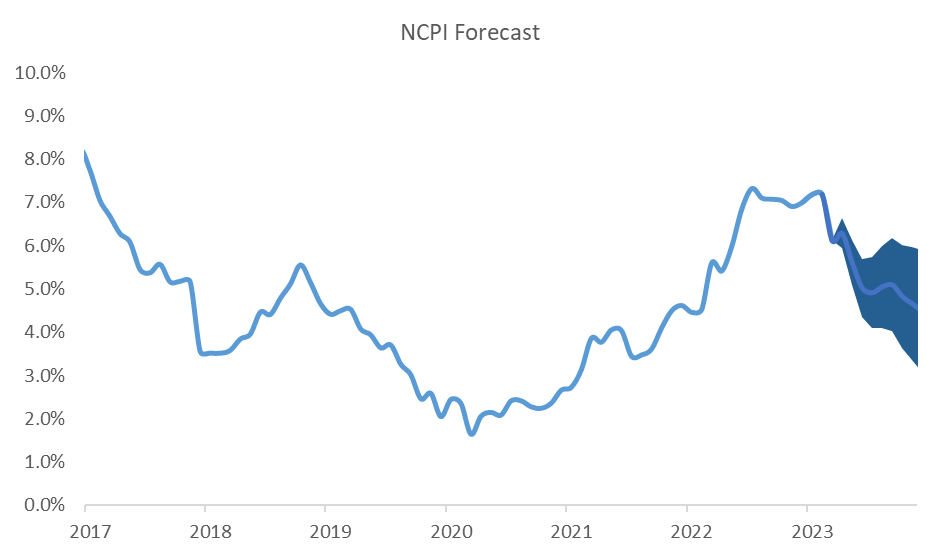
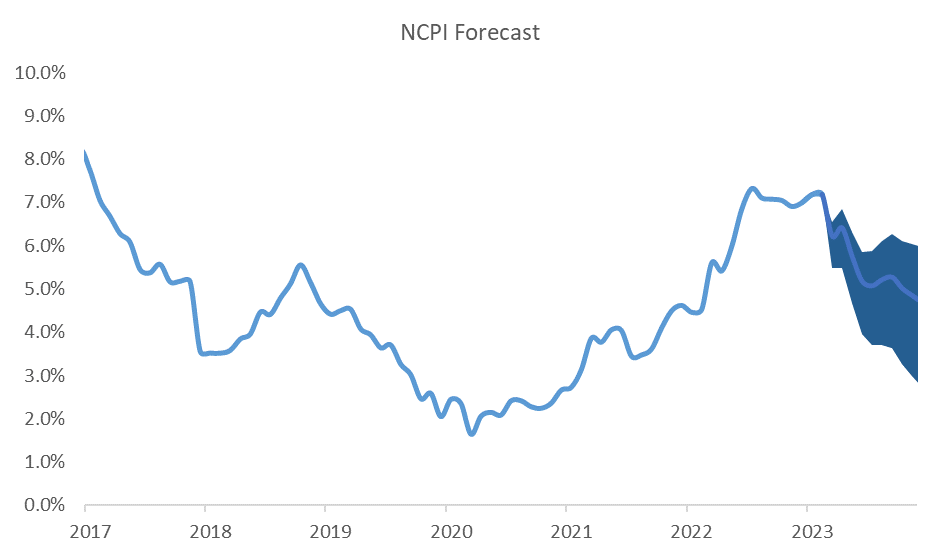
IJG’s inflation model continues to forecast a gradual deceleration in the annual inflation rate over the coming months, before ending the year at around 4.8%.
NCPI April 2023

Namibia’s annual inflation rate softened to 6.1% y/y in April. On a month-on-month basis, prices in the overall NCPI basket rose by 0.4% m/m, following the 0.6% m/m increase in March. On an annual basis, overall prices in three of the twelve basket categories rose at a quicker rate in April than in March, eight categories recorded slower rates of inflation while inflation in the education category remained steady over the period. Inflation on services ticked up to 3.2% y/y while inflation on goods edged lower to 8.2% y/y.

Inflation Attribution

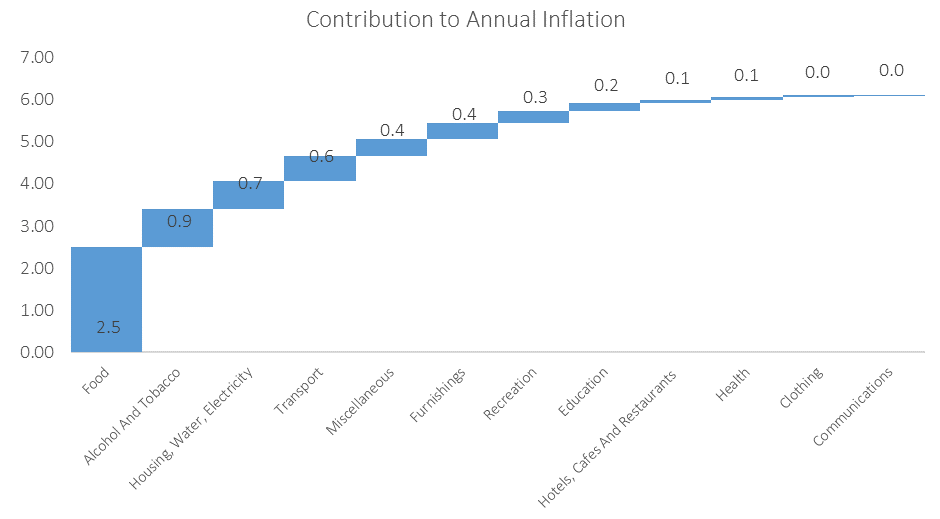
The Food and Non-Alcoholic beverages basket item was once again the largest contributor to Namibia’s annual inflation rate, contributing 2.5 percentage points in April. Prices of this basket item increased by 0.5% m/m and 13.5% y/y. The year-on-year inflation rates for most of the sub-categories in this basket category slowed from March but remain relatively elevated. Fruits posted the highest year-on-year inflation followed by Breads and Cereals. Fruit prices increased by 1.2% m/m and 28.5% y/y, marginally slower than the 29.1% y/y increase recorded a month earlier. Prices of the Breads and Cereals sub-category fell by 0.1% m/m but remain high considering that prices of this sub-category are 19.8% higher than they were a year ago. Vegetables and Fish were the only sub-categories which recorded quicker inflation compared to March on a year-on-year basis. Prices of the Vegetables sub-category rose by 2.5% m/m and 15.2% y/y, while prices of the Fish sub-category increased by 0.5% m/m and 8.8% y/y.

The Alcohol and Tobacco basket item was the second largest contributor to April’s inflation print, contributing 0.9 percentage points. Prices in this category rose by 0.6% m/m and 6.7% y/y. Inflation on alcohol products came in at 7.6% y/y, a slight uptick from the 7.4% y/y reported in March. Tobacco product inflation came in at 2.6% y/y, down from 4.8% y/y a month ago. Six of the nine sub-categories in this basket item posted either slowing or steady inflation. Pipe Tobacco, Brandies and Beers/Ales/Ciders were the only sub-categories which saw prices grow faster in April than in March.

Housing, Water and Electricity, which has the heaviest weighting in the inflation basket at 28.4%, was the largest contributor to inflation among the remaining categories and replaced Transport as one of the top three contributors to Namibia’s annual inflation print. Inflation in this category came in at 2.6% y/y in April, down from 3.0% y/y in March. All four sub-categories in this basket item recorded slowing inflation compared to March on a year-on-year basis. Prices of Electricity, Gas and Other Fuels fell by 0.4% m/m, while annual inflation in this subcategory slowed to 4.9%. Prices in the Regular Maintenance and Repair of Dwelling sub-category decreased by 0.4% m/m with annual inflation coming in at 4.8%. Rental inflation and prices of Water Supply, Sewerage Service and Refuse remained steady month-on-month with annual inflation at 2.1% and 2.5%, respectively.

Outlook

The steep drop in April’s inflation print to 6.1% is primarily due to base effects in the Transport category with fuel prices now only marginally higher than they were a year ago. Still, the slowdown should be a welcome development for the Bank of Namibia (BoN) and its quest to temper inflationary pressure. The drop in April’s inflation print, coupled with the fact that we see inflation starting to ease in other parts of the world, may signal the start of a much-anticipated disinflationary cycle which in turn could see the end of the BoN’s tightening of the belt. The BoN raised lending rates by a further 25bps last month, again deciding to not hike as aggressively as the South African Reserve Bank (SARB) last time round and now lags the SARB’s lending rate by 50bps.  Elevated food prices and a weak currency do however pose risks to the BoN’s inflation fight.

IJG’s inflation model continue to predict a gradual slowdown in Namibia’s annual inflation rate over the remainder of year, before ending the year at around 4.8%.

NCPI March 2023

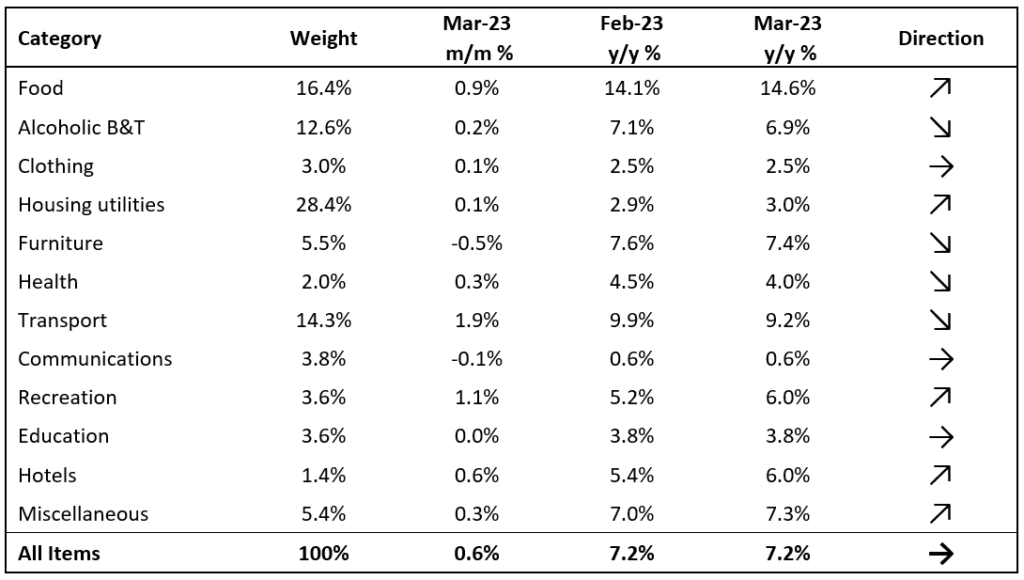
Namibia’s annual inflation rate remained unchanged at 7.2% y/y in March. On a month-on-month basis, prices in the overall NCPI basket rose by 0.6%, compared to a 0.4% m/m increase in February. On an annual basis, overall prices in five of the twelve basket categories rose at a quicker rate in March than in February, four categories recorded slower rates of inflation and three recorded inflation rates consistent with those in February. Inflation on goods and services remained steady at 10.1% y/y and 3.1% y/y, respectively.

Inflation Attribution
 
Food and non-alcoholic beverages remain the largest contributor to inflation, contributing 2.7 percentage points to March’s annual inflation print. Food and non-alcoholic beverage prices rose by 0.9% m/m and 14.6% y/y, the highest annual inflation print for this category since March 2009. Most of the sub-categories in this basket item posted higher annual inflation compared to February. Fruit again posted the highest inflation print of all the sub-categories. Fruit prices rose by 1.4% m/m and 29.1% y/y. Breads and cereals were the only sub-category registering slowing inflation. Prices in this sub-category, however, remained elevated after rising by 0.9% m/m and 20.8% y/y in March.
 
Transport was the second largest contributor to the annual inflation print in March, contributing 1.4 percentage points. Prices in this basket category rose by 1.9% m/m and by 9.2% y/y in March.  Operation of personal transport equipment inflation continued to decelerate with prices in this sub-category rising by 12.5% y/y compared to 14.2% y/y in February. The Ministry of Mines and Energy’s decision to leave the price of petrol and diesel unchanged for April means we could see the trend continue into next month’s inflation print. Purchase of vehicles inflation accelerated. Prices in this subcategory rose by 1.1% m/m while annual inflation increased to 6.0% from 5.3% in February. Public transportation services inflation decelerated slightly to 1.0% y/y from 1.1% y/y a month earlier while prices remained steady month-on-month.

As the graph above shows, the largest contributor to inflation among the remaining categories was the alcohol and tobacco basket item. Prices in this category rose by 0.2% m/m and 6.9% y/y in March compared to increases of 0.4% m/m and 7.1% y/y in February. Both alcohol and tobacco sub-categories posted slightly slower rates of inflation. Alcoholic beverage inflation slowed to 7.4% y/y from 7.6% y/y in February. White spirits continue to be a notable driver of inflation pressure in this sub-category with annual inflation on white spirits accelerating for the fourth consecutive month to 28.3% from 26.0% a month ago. Tobacco products inflation slowed to 4.8% y/y from 5.1% in February. Inflation on cigarettes remained steady at 5.8% y/y while pipe tobacco inflation slowed to 1.8% y/y from 2.9% y/y. in February. As noted in last months’ NCPI report, we anticipate more price pressures to come from this sub-category following the announcement of a steep rise in “sin taxes” on alcoholic beverages and tobacco products during February’s annual budget speech.

Outlook

March’s sticky inflation print of 7.2% comes as a surprise given that we expected some easing like we have seen from recent CPI prints in other parts of the world. This means that the much-anticipated disinflationary cycle has yet to come into effect, setting the stage for a prolonged restrictive monetary policy stance as was alluded to during last month’s report. 

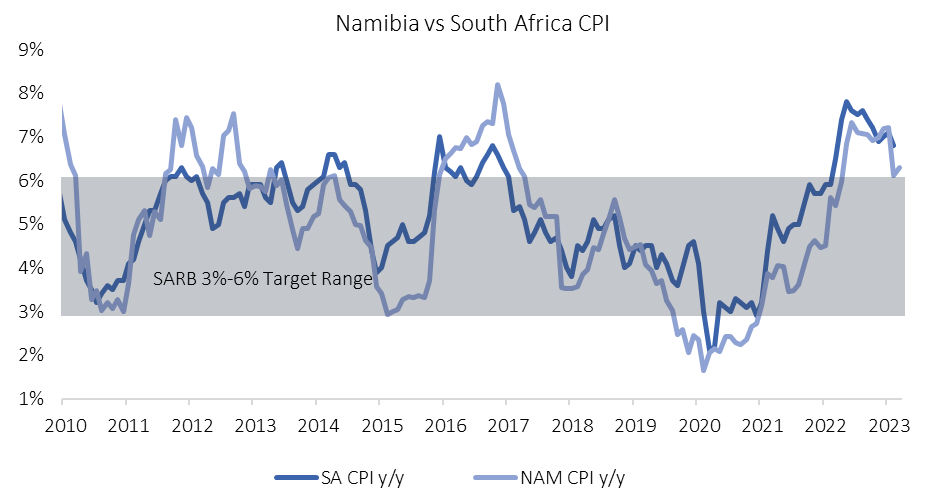
The SARB raised its lending rate by a further 50bps in March, implying that its monetary policy committee is of the view that more needs to be done in terms of curbing inflation and bringing it within the target range. The Bank of Namibian (BoN) will almost certainly respond in kind when it holds its MPC meeting on 19 April. Namibia’s inflation has been trending slightly higher than South Africa’s in recent months as the graph above shows and this trend will also be on the radar of the BoN’s MPC when it decides on the extent of further tightening required to keep price stability and the currency peg in check.

IJG’s inflation model continue to predict a gradual slowdown in Namibia’s annual inflation rate over the remainder of year, before ending the year at around 4.8%.