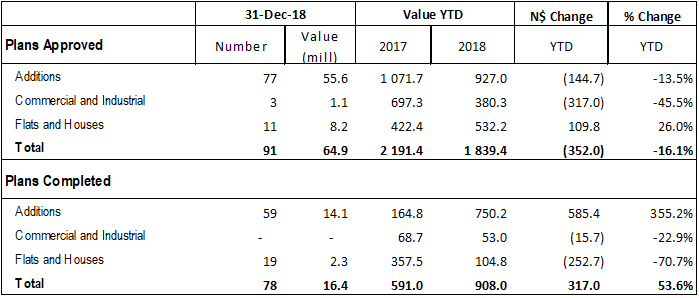
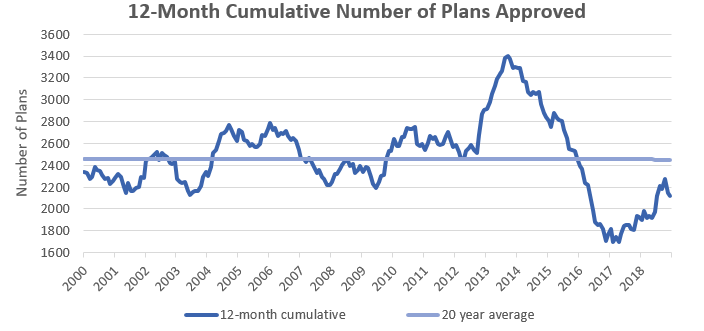
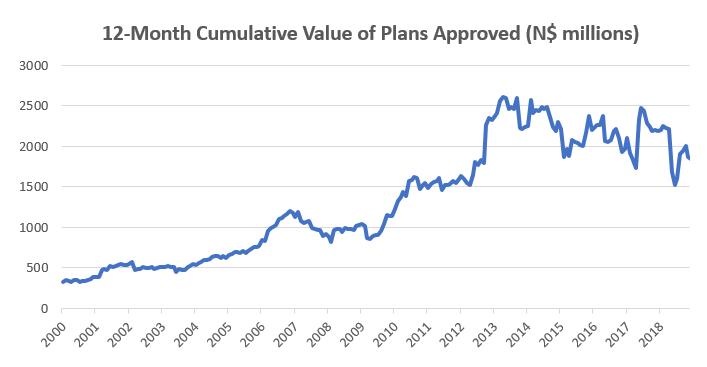
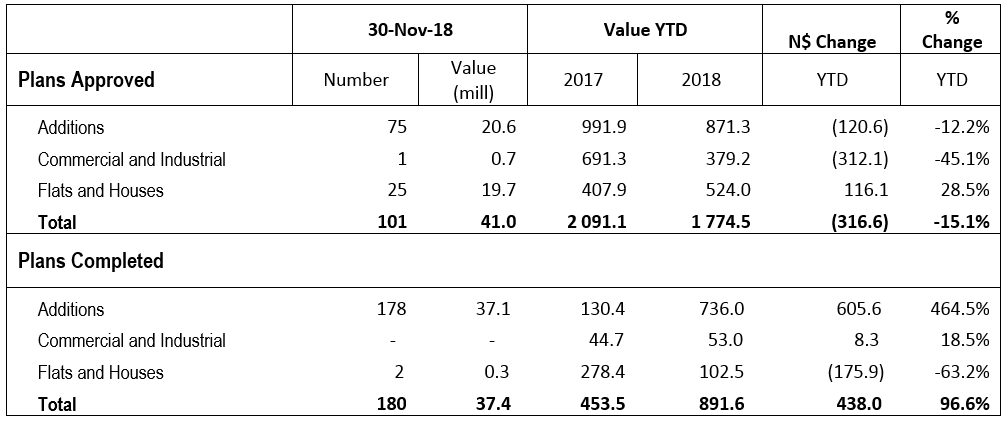
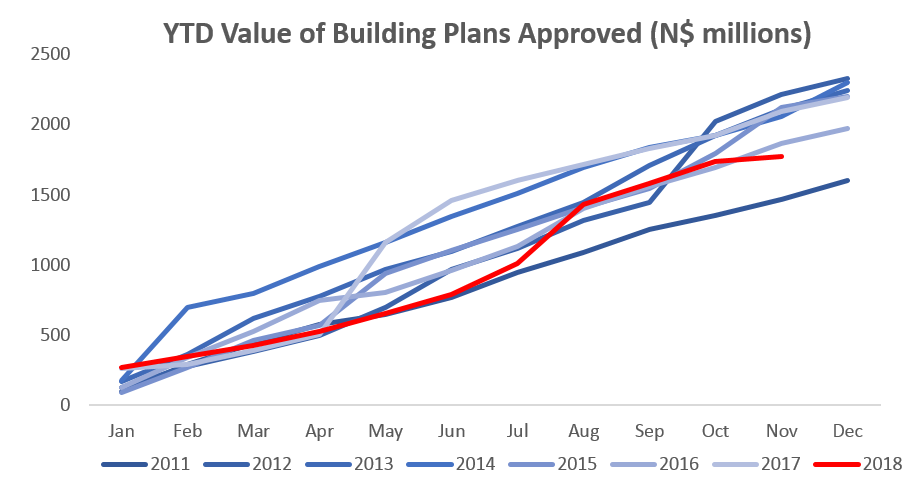
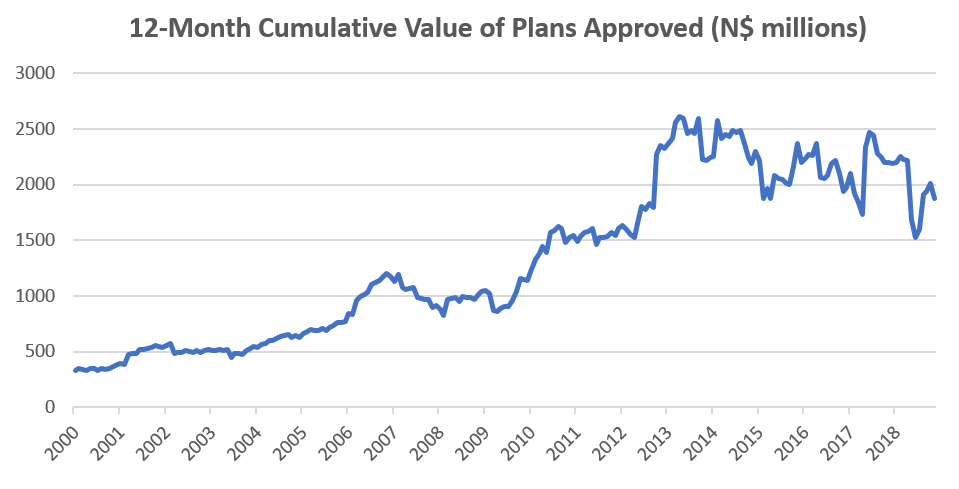
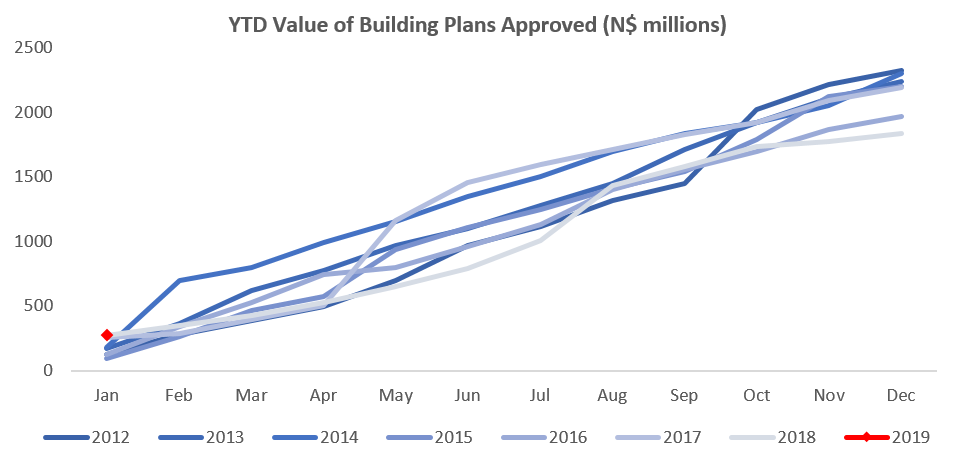
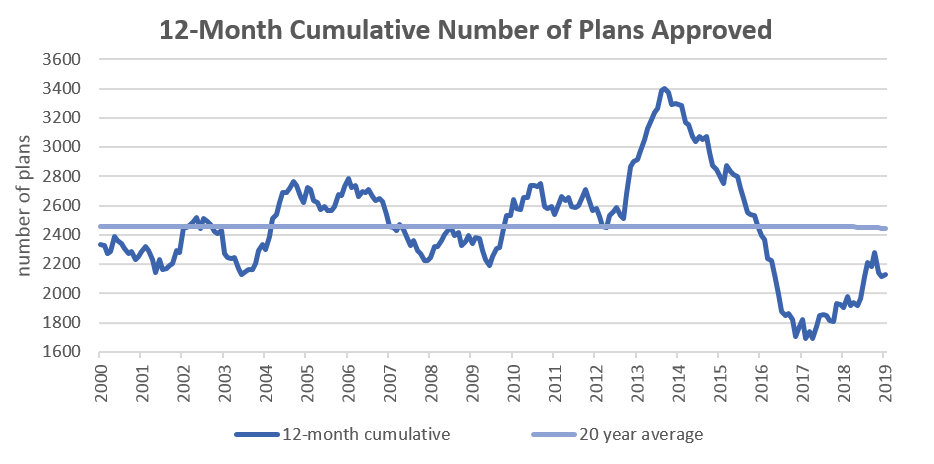
A total of 162 building plans were approved by the City of Windhoek in January, representing a 78.0% m/m increase from the 91 in December. The value of building plans approved increased by N$207.8 million from N$64.9 million in December to N$272.7 million in January. 87 Buildings with a value of N$54.2 million were completed in January, versus 78 buildings worth N$16.4 million completed in December. January 2019 is off to a slightly better start in terms of both number and value of approvals, compared to January 2018 when 153 building plans worth N$269.3 million got the nod. On a twelve-month cumulative basis, 2,127 building plans worth approximately N$1.84 billion were approved, an increase in number of 11.8% y/y, but a decrease of 16.3% in value terms over the prior 12-month period.
In terms of number of approvals, additions to properties made up the largest portion of approvals. For the month of January, 131 additions to properties were approved with a value of N$34.8 million, N$197.9 million less in value terms than in January 2018, but 2 more than the number of additions observed in the first month of 2018.
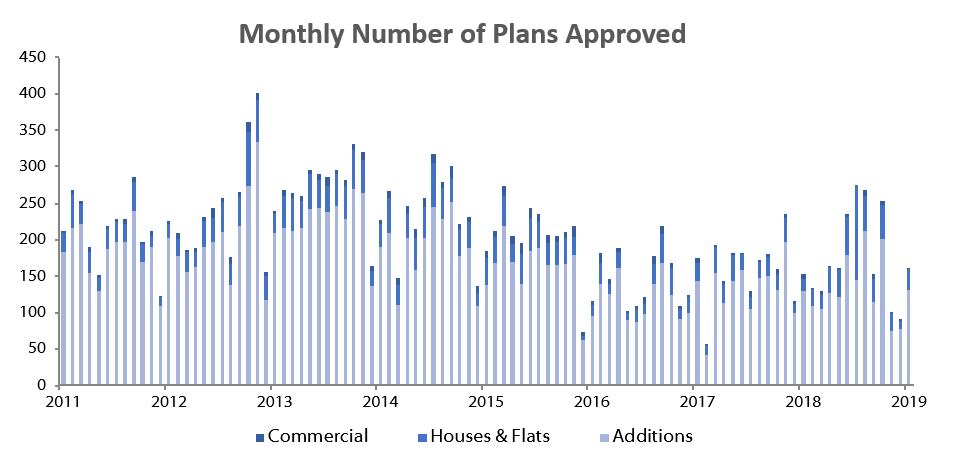
New residential units were the second largest contributor to the total number of building plans approved in January. 29 new units worth N$167.9 million were approved in January, representing a 580.2% increase from the N$24.7 million approved in the first month of 2018. It is however worth noting that one of these approvals is a N$125.0 million residential project approved for the city centre.
The number of commercial and industrial units approved in January only amounted to 2, valued at N$70.0 million. This compares to 7 units valued at N$11.9 million approved in January 2018. On average over the last 20 years, 4 commercial units valued at N$19.6 million were approved in the first month of the year.

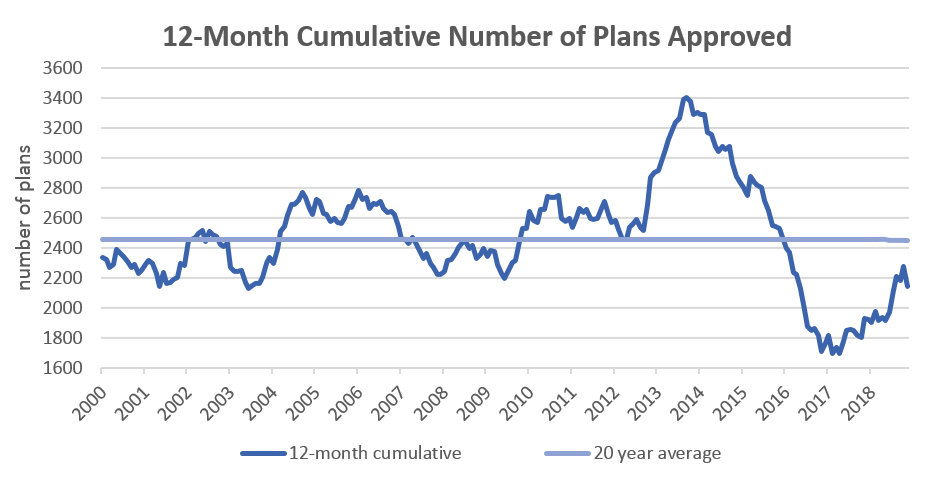
The 12-month cumulative number of building plans approved ticked up slightly in January with an 11.8% y/y increase. A total of 2,127 building plans to the value of N$1.8 billion were approved over the last 12 months which represents a decrease in value terms of 16.3% y/y. The majority of these approvals are additions to properties which are typically of low relative value. Growth in commercial and industrial construction activity remains extremely subdued as the decrease (on a 12-month cumulative basis) in credit extended to corporates also reflects.
With government still in a fiscal consolidation cycle and spending less on capital and infrastructure projects, we expect the sector to remain under pressure for most part of the year. The mid-term budget released late last year pointed to little additional public funds flowing into the sector. In fact, funds were prioritised to operational expenditure with the African Development Bank loan replacing the funding for larger infrastructure projects in 2019. Infrastructure funding from outside Namibia as well as public private partnerships are now necessary to drive the infrastructure investment that Namibia so desperately needs. We may see more efforts to attract and deploy funds from external sources in 2019 due to it being an election year, which may provide some potential for industry growth.