
Twitter Timeline
[custom-twitter-feeds]
Categories
- Calculators (1)
- Company Research (300)
- Capricorn Investment Group (52)
- FirstRand Namibia (54)
- Letshego Holdings Namibia (26)
- Mobile Telecommunications Limited (7)
- NamAsset (3)
- Namibia Breweries (45)
- Oryx Properties (59)
- Paratus Namibia Holdings (6)
- SBN Holdings Limited (18)
- Economic Research (661)
- BoN MPC Meetings (13)
- Budget (19)
- Building Plans (142)
- Inflation (143)
- Other (28)
- Outlook (17)
- Presentations (2)
- Private Sector Credit Extension (141)
- Tourism (7)
- Trade Statistics (4)
- Vehicle Sales (143)
- Media (25)
- Print Media (15)
- TV Interviews (9)
- Regular Research (1,813)
- Business Climate Monitor (75)
- IJG Daily (1,616)
- IJG Elephant Book (12)
- IJG Monthly (108)
- Team Commentary (250)
- Danie van Wyk (61)
- Dylan van Wyk (27)
- Eric van Zyl (16)
- Hugo van den Heever (1)
- Leon Maloney (11)
- Top of Mind (4)
- Zane Feris (12)
- Uncategorized (6)
- Valuation (4,512)
- Asset Performance (116)
- IJG All Bond Index (2,094)
- IJG Daily Valuation (1,814)
- Weekly Yield Curve (487)
Meta
Author Archives: IJGResearch
IJG Daily Valuation 17 April 2019
New Vehicle Sales – March 2019
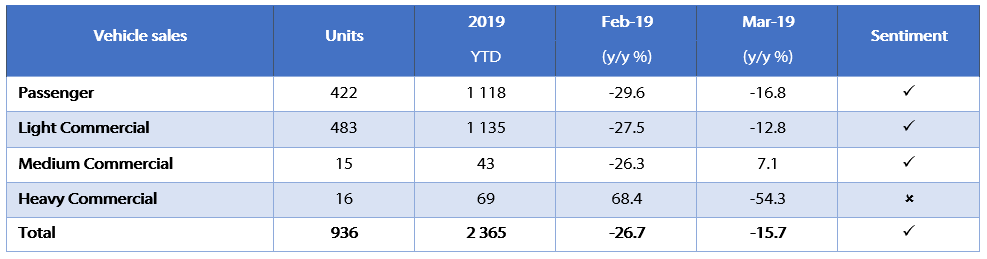
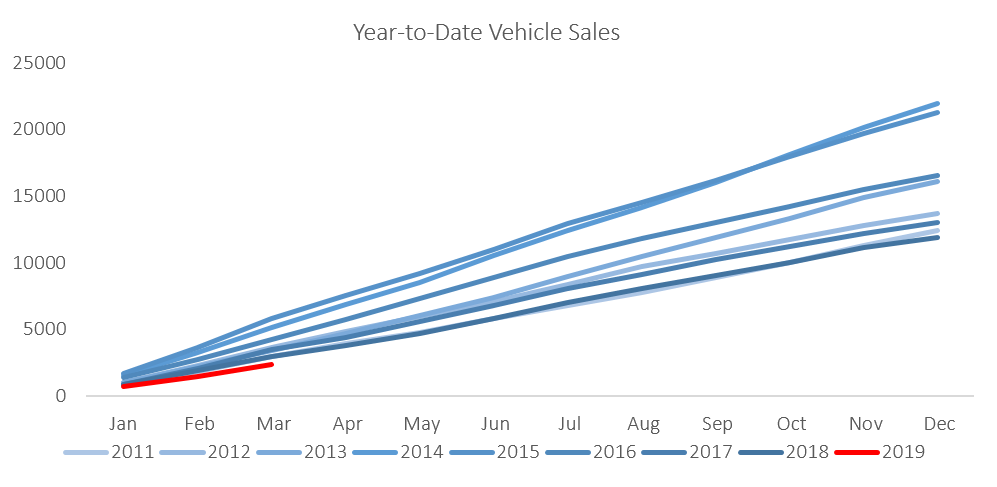
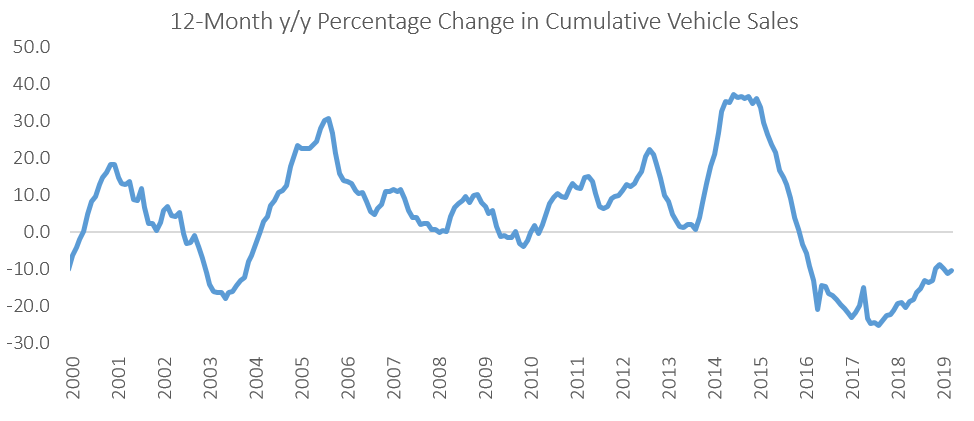
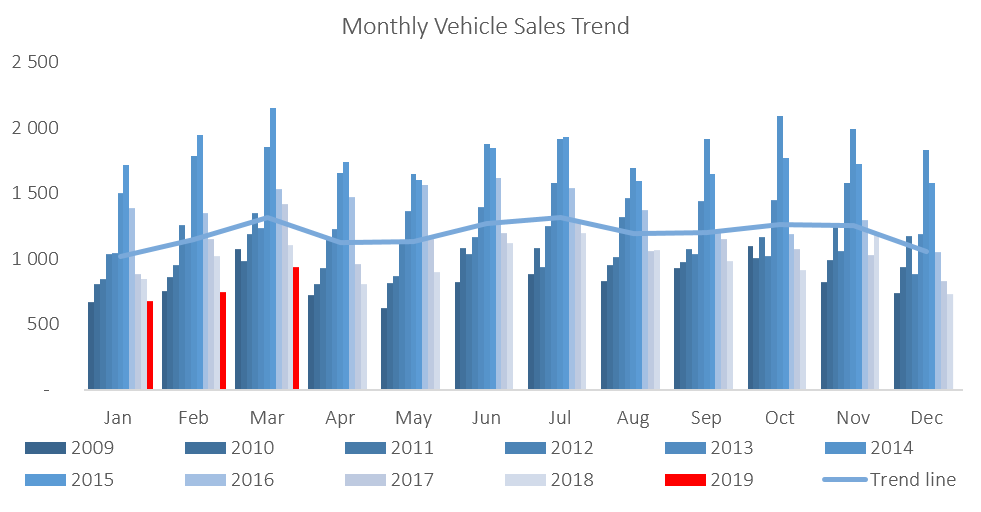
A total of 936 new vehicles were sold in March, representing a 24.6% m/m increase from the 751 vehicles sold in February. It should be noted that March vehicle sales have a seasonal effect of being slightly higher due to it being the end of the tax year. Year-to-date, 2,365 vehicles have been sold of which 1,118 were passenger vehicles, 1,135 light commercial vehicles, and 112 medium and heavy commercial vehicles. This is a 20.8% decline in the total number of new vehicles sold during the first quarter of 2019 when compared to 2018. On a twelve month-cumulative basis, vehicle sales continue to wane with a total of 11,285 new vehicles sold as at March 2019, down 10.3% from the 12,577 sold over the comparable period a year ago, and the lowest since November 2010.
422 New passenger vehicles were sold during March, increasing by 19.2% m/m. From a year-on-year perspective however, March new passenger vehicle sales were 16.8% lower than the 507 units sold in March 2018. Year-to-date, passenger vehicle sales rose to 1,118, reflecting lower annual sales than the preceding 8 years, and a 20.9% decline from the first quarter of 2018.
A total of 514 new commercial vehicles were sold in March, representing an increase of 29.5% m/m, but a contraction of 14.8% y/y. Of the 514 commercial vehicles sold in March, 483 were classified as light, 15 as medium and 16 as heavy. On an annual basis, light commercial sales fell by 12.8%, medium commercial sales grew by 7.1% while heavy and extra heavy sales have contracted by 54.3%. On a twelve-month cumulative basis, light commercial vehicle sales dropped 11.7% y/y, while medium commercial vehicle sales rose 13.1% y/y, and heavy commercial vehicle sales fell 6.3% y/y. This is the sixth consecutive month that medium commercial sales have showed growth on a twelve-month cumulative basis.
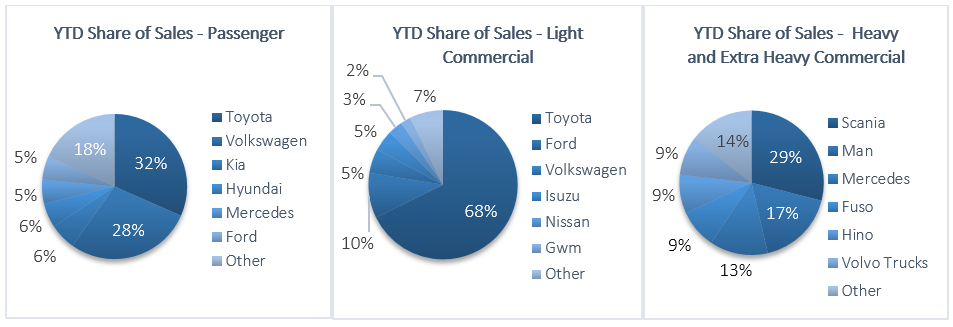
Toyota retook the lead from Volkswagen in March in terms of year-to-date market share of new passenger vehicles sold. Toyota claimed 31.6% of the market, followed closely by Volkswagen with 28.3% of the market. They were followed by Kia and Hyundai with 5.9% and 5.5% of the market respectively, while the rest of the passenger vehicle market was shared by several other competitors.
Toyota remained the leader in the light commercial vehicle space with a 67.8% market share, with Ford in second place with a 9.8% market share. Volkswagen and Isuzu claimed 5.3% and 4.5%, respectively, of the number of light commercial vehicles sold thus far in 2019. Hino leads the medium commercial vehicle segment with 37.2% of sales while Scania was number one in the heavy and extra-heavy commercial vehicle segment with 29.0% of the market share year-to-date.
The Bottom Line
New vehicle sales remained depressed in March as 12-month cumulative new vehicle sales have declined by 10.3% y/y to 11,285 at the end of March, representing a decline of 50.2% from the peak of 22,664 new vehicle sales recorded in April 2015. Government’s continued commitment to fiscal consolidation does have a direct effect on the demand for new vehicles. Government vehicle expenditure has fallen from N$1.02 billion in the 2014/15 fiscal year to N$22.2 million in 2017/18. In his Budget Review Speech last month, finance minister Calle Schlettwein left the revised vehicle budget unchanged at N$11.9 million from the mid-term budget tabled in October last year. N$1.4 million is allocated to the Auditor General’s office for vehicles, N$10.0 million to Health and Social Services and N$500,000 to the Justice ministry. For the 2019/20 year, N$10.0 million is allocated to Health and Social Services for vehicles. These figures dim the prospects for new vehicle sales in the short- to medium-term.